The distribution of stellar masses that is produced as a molecular cloud fragments is one of the most quantitative clues we have about the physics of the star formation process.

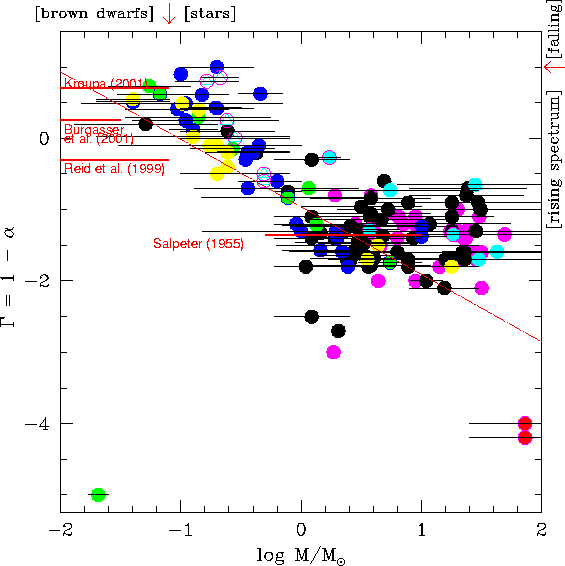
Shown are the values quoted for the slope of the initial mass function [dN(logM)/d(logM) µ M G ] as measured by -- I believe all -- modern authors up to September 2002, plotted against the mean mass covered by each study. The horizontal black lines show the range of masses over which the single slope is claimed to apply.
Data points from studies of the Orion Nebula Cluster are in green, with those points I have been personally associated with green surrounded by blue circles. Yellow points represent results from young populations associated with molecular clouds other than the ONC cloud (i.e. other star-forming regions). Dark blue points are possibly bound open clusters such as h/Chi Per, Alpha Per, Pleiades, M35, and Praesepe. Black points are other galactic clusters and OB associations. Purple (magenta) points are regions in the LMC. Light blue (cyan) points are "extreme environments" such as NGC 3603, Arches/Quintuplet, and R136. Also in cyan (triangles) are a few galactic globular clusters, though I have not kept up with this literature as much as I would like to.
What is quite clear from this figure is that even when authors force a power law fit through their data, the composite of these power laws is very much *not* a power law. The continual change of the mass function slope with mean mass below about 1 Msun demonstrates that a quadratic or log-normal function best describes the composite data at low masses. This is not to say, however, that the composite results are an accurate description of any individual region included in this figure. The relatively small scatter at low masses is quite surprising given the variety of observational techniques and the variety of transformations between the observations and stellar masses that are used. Above masses of several Msun the scatter is more considerable, and the quadratic or log-normal function that may describe the lower masses yields to a flatter slope which does not appear to change to with mean mass and is centered on the Salpeter (1955) value of G = -1.35. The Salpeter slope holds down to at least 1 Msun and plausibly down to 0.6 Msun. The dash-dot line in red shows the Miller-Scalo (1979) log-normal relation while red solid lines represent other field star results in the solar neighborhood, from Reid et al. (1999) and Kroupa (2000). None of these red lines is a good match to the data at low masses, though a steeper log-normal form would just about do it.
Note that the mass spectrum dN(M)/d(M) µ M-a and that G = 1 - a. Thus G = +1 corresponds to a = 0 or the division between a rising (more stars at lower masses) and a falling (more stars at higher masses) mass spectrum.
This plot was inspired by similar plots published by J. Scalo and P. Kroupa.