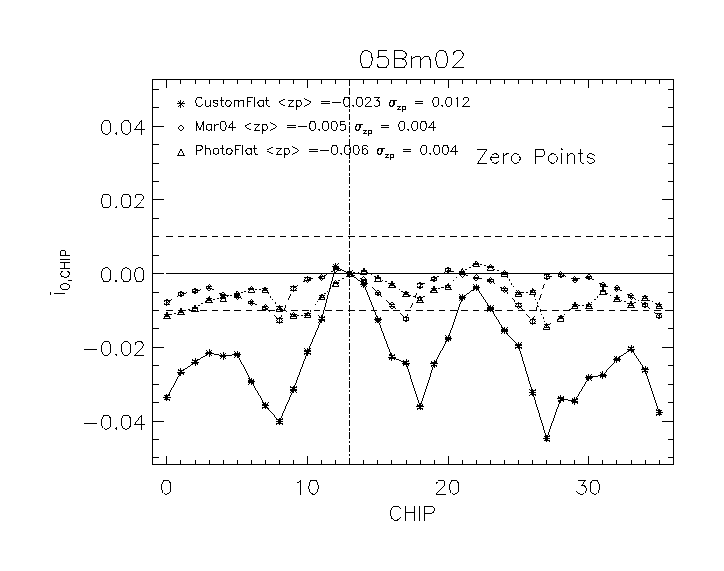
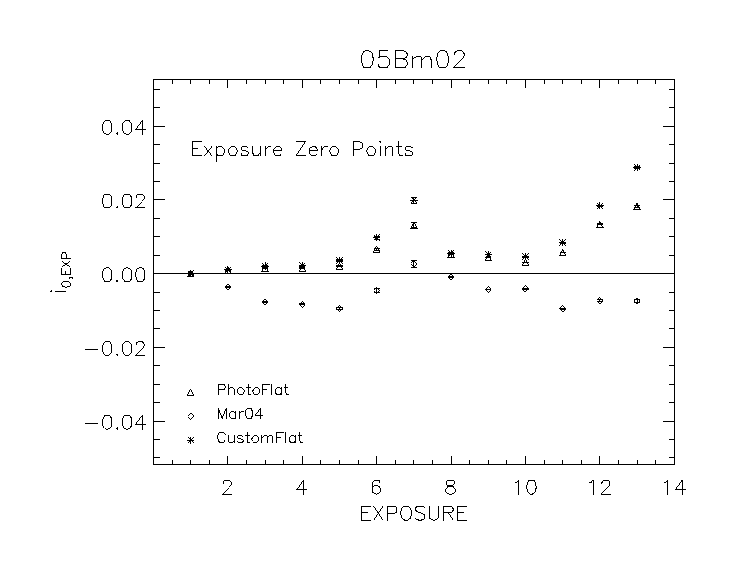
Comparison - Here we compare the parameter fits using
CustomFlat,
PhotFlat, and
Mar04 photogrid data. The first plot
is the chip-to-chip zeropoint relative to the reference chip, indicated by
the vertical dot-dashed line, and the second is the exposure-to-exposure
zeropoint relative to the first exposure. All y values are in magnitudes.
i' Plots
| Chip Zero Points |  |
| Exposure Zero Points |  |


