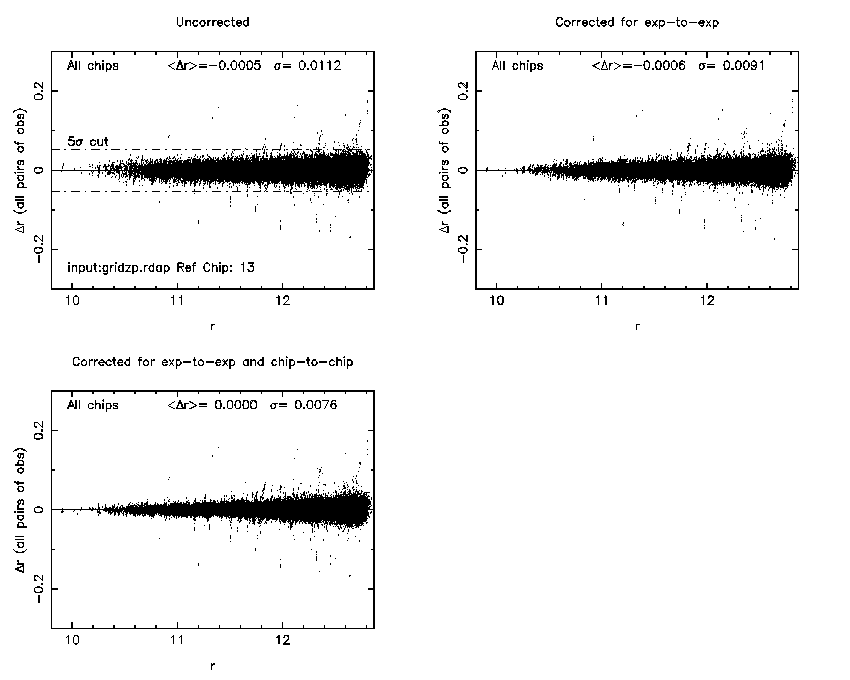
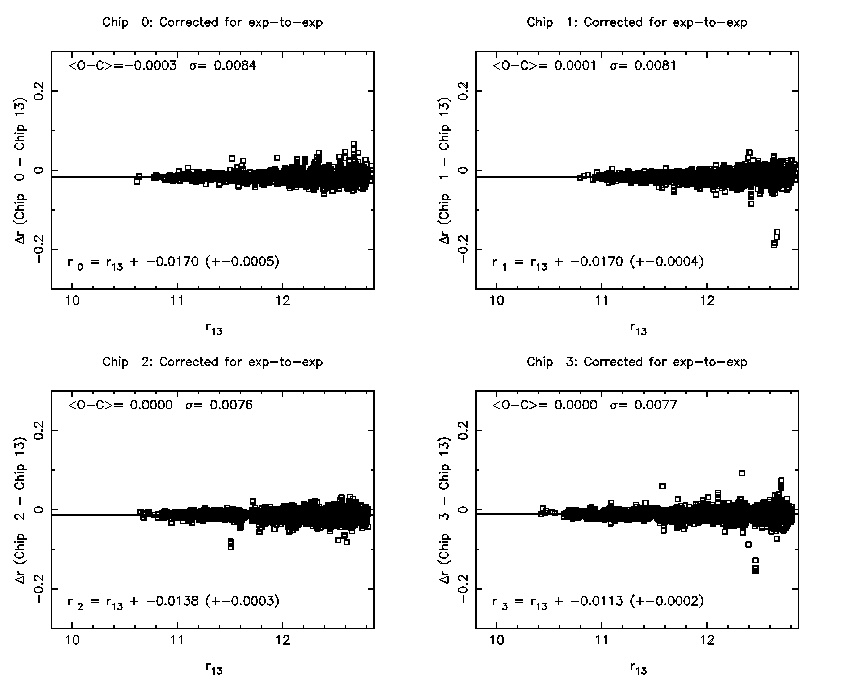
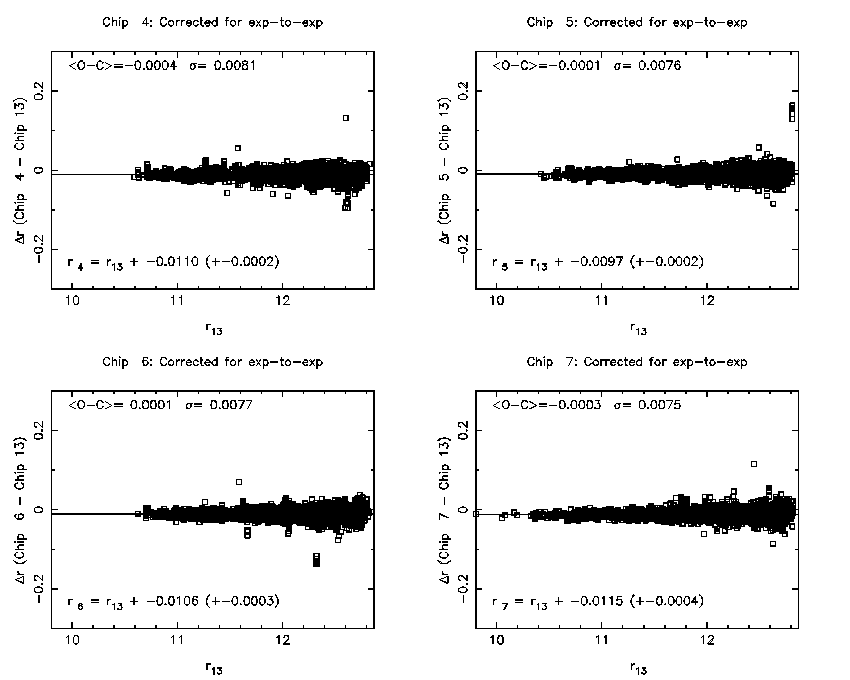
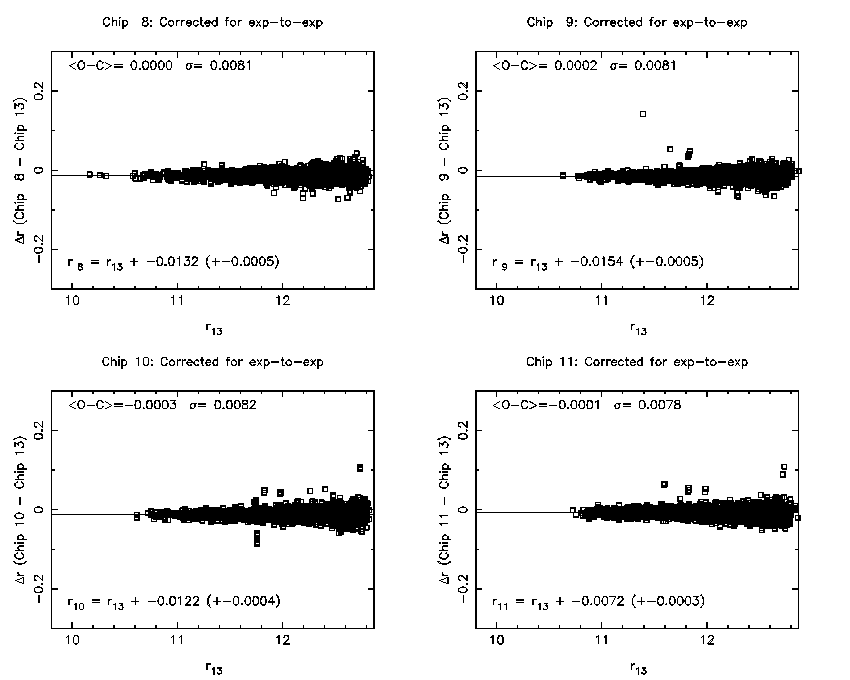
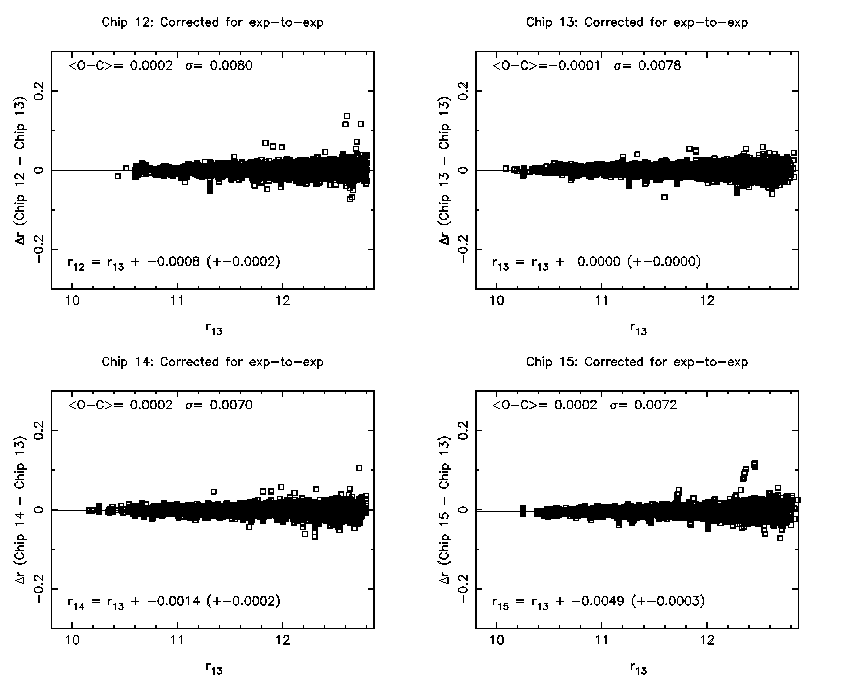
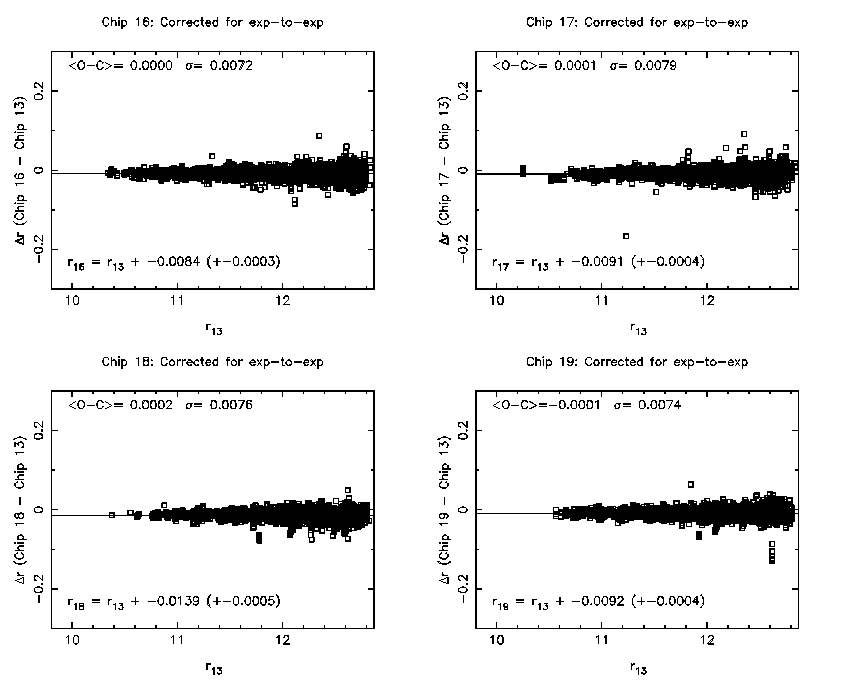
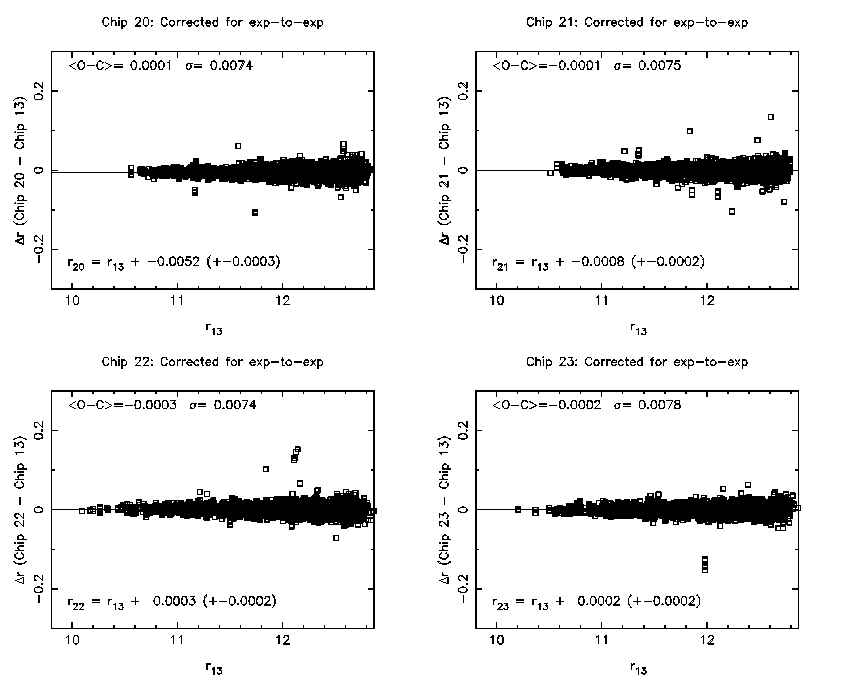
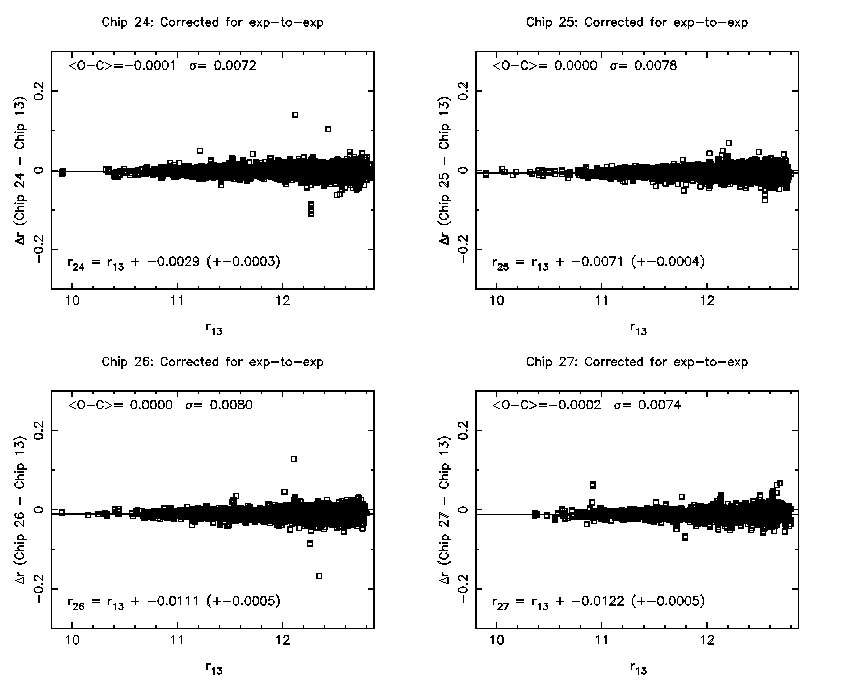
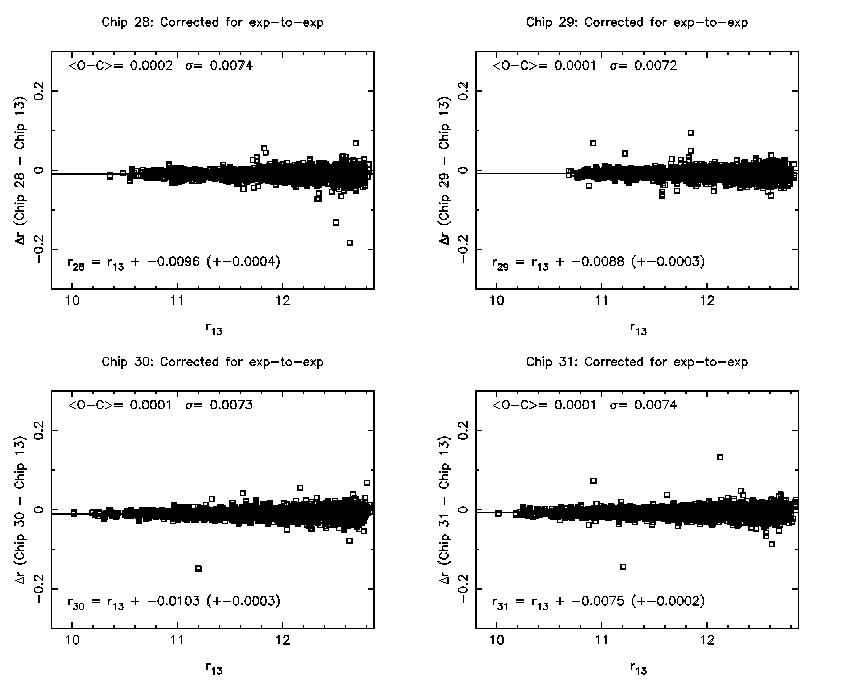
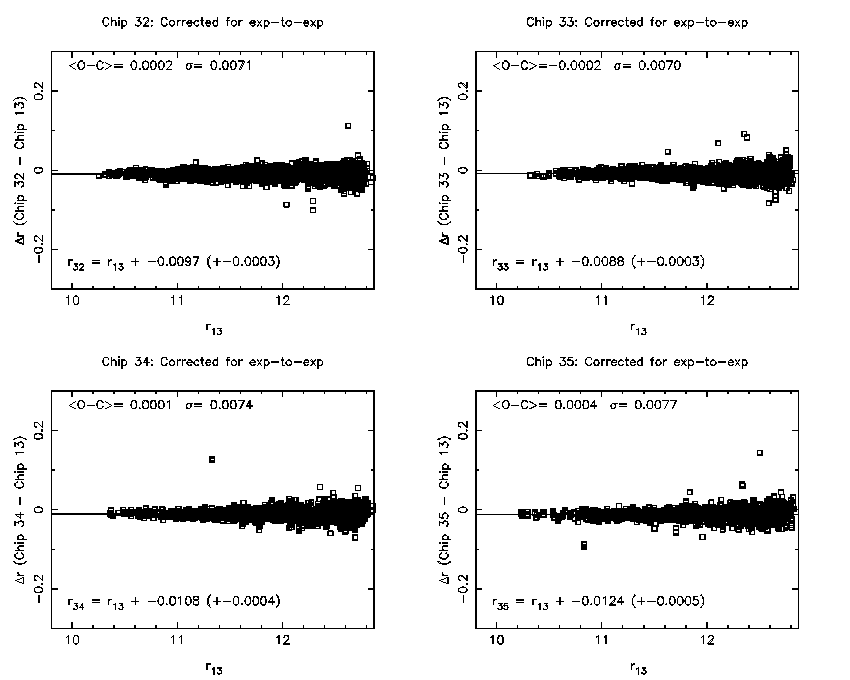
The x-axis is the magnitude of the star corrected to chip 13, exposure 1. The y-axis is the difference in the magnitude of two observations of a star.
| Raw Data |  |
| chips 00 - 03 |  |
| chips 04 - 07 |  |
| chips 08 - 11 |  |
| chips 12 - 15 |  |
| chips 16 - 19 |  |
| chips 20 - 23 |  |
| chips 24 - 27 |  |
| chips 28 - 31 |  |
| chips 32 - 35 |  |