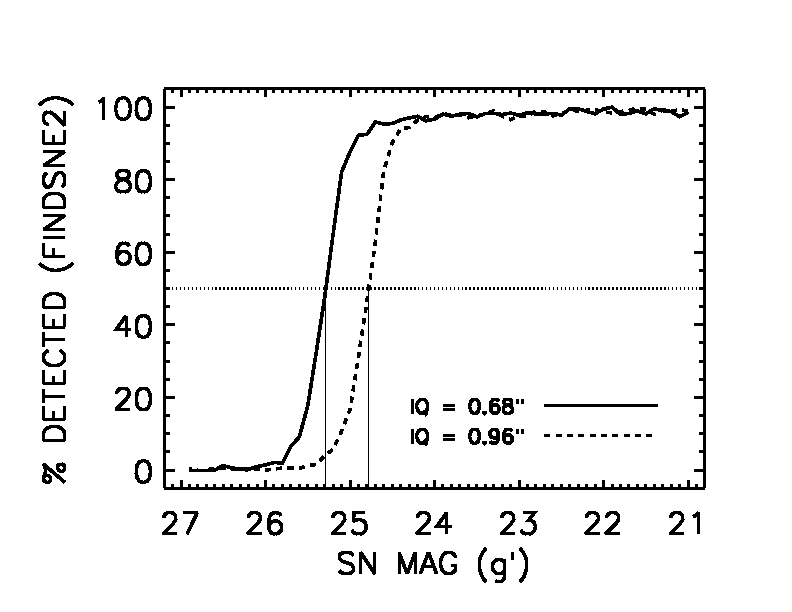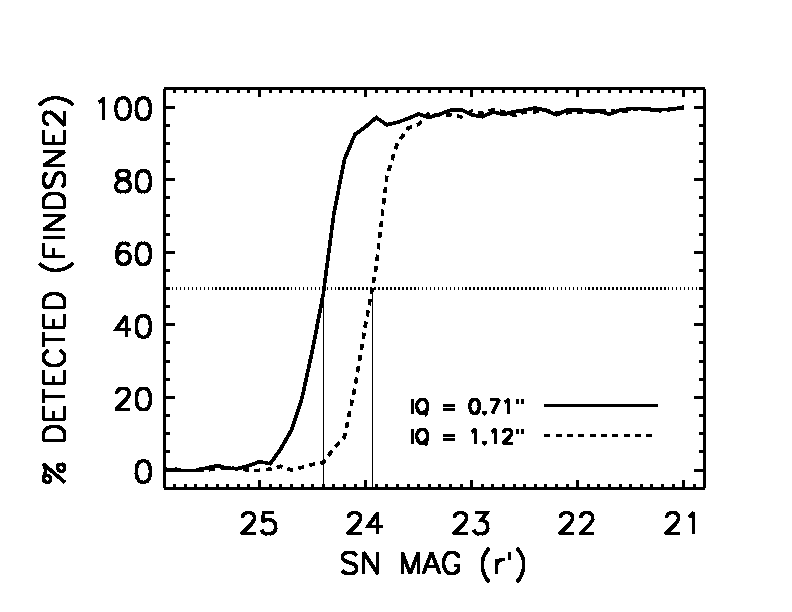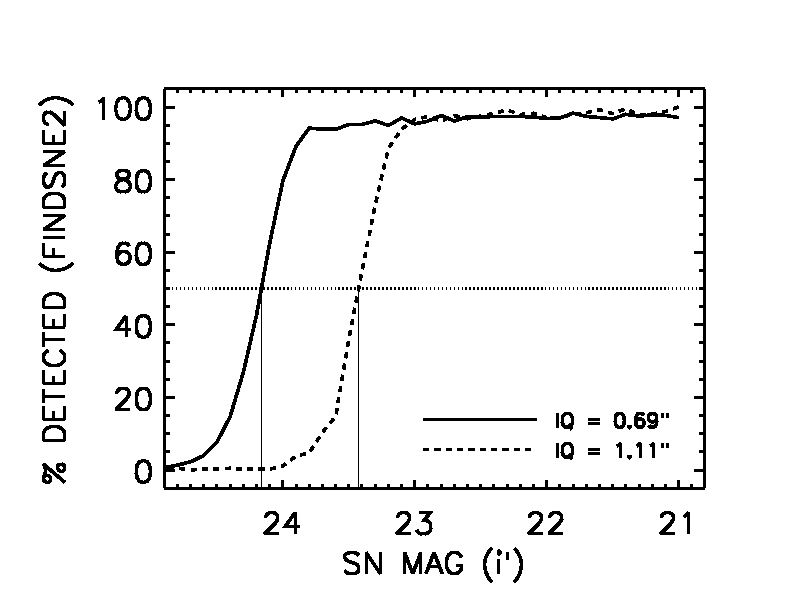
Fake SNe were added to images with two different IQ to determine the effect that IQ has on detectability. The detection pipeline that was run on the fake SNe is the exact same one that is used by the Canadian SNLS team. The first cut is done with a routine called findsne2 and the second cut consists of human review of the candidates that survive the first cut. The images are prepared for human review by a program called review2.
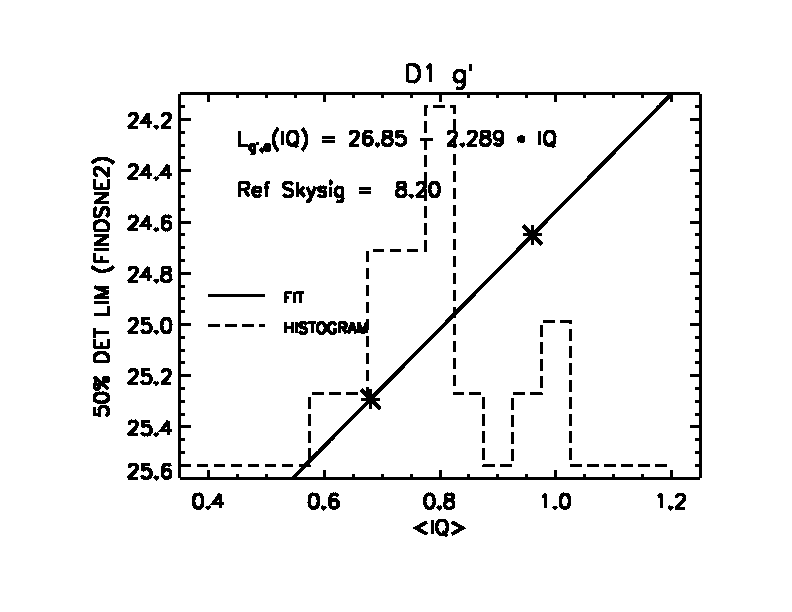
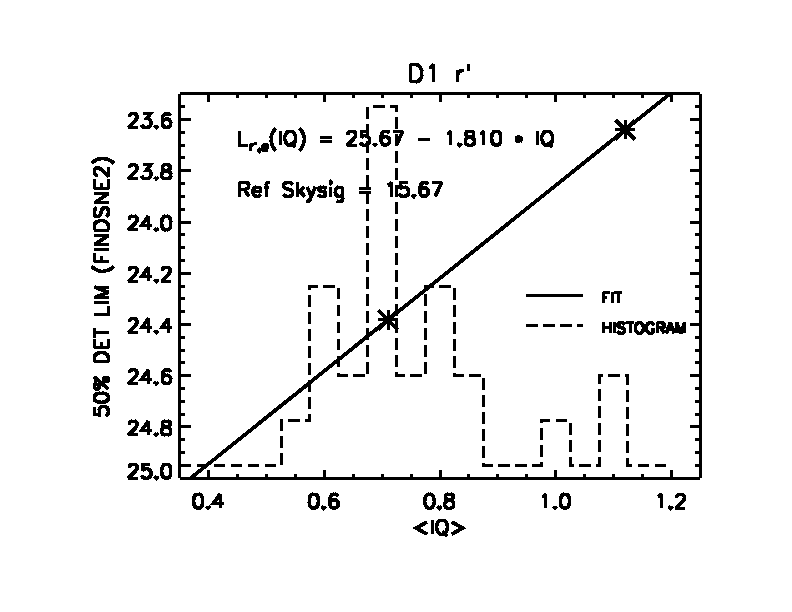
These limits are then implemented in the Monte Carlo simulations to define when we have a SN Ia that enters our final sample for calculating the rate. The 50% completeness limits are used because the same number of candidates are lost below the limit as are gained above the limit (see plots below).
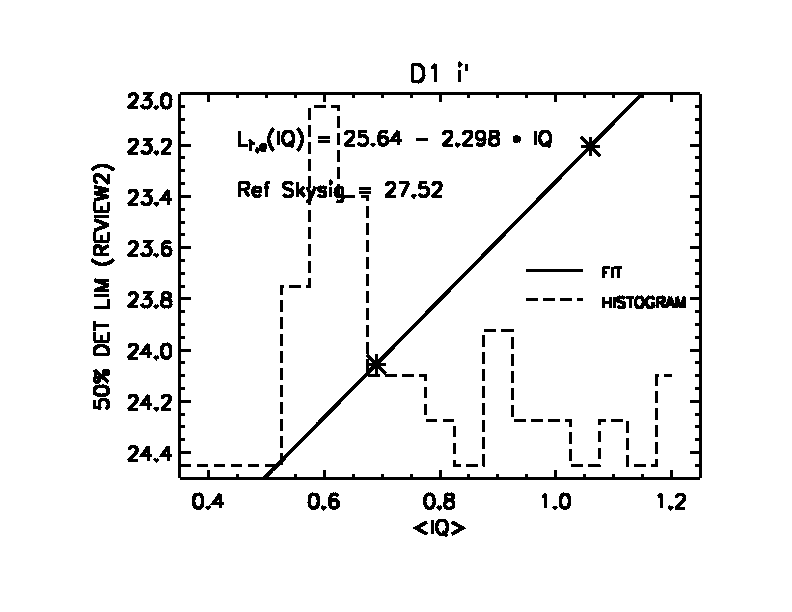
The sky noise on these images was noted and used as a reference for computing the detectability of a given SNLS frame. We looked at the variation of the sky noise for the survey and implemented it into our simulation. We also accounted for it in the frame limit calculation itself and used the good seeing image sky noise as the reference. This sky noise value is annotated on the plots below.
Since i' is used by the Canadian SNLS pipeline for detecting SN Ia candidates, we must find out the detection fraction at each IQ for both the initial and final cuts. The detection fraction as a function of magnitude for both IQ are plotted below for the findsne2 cut:
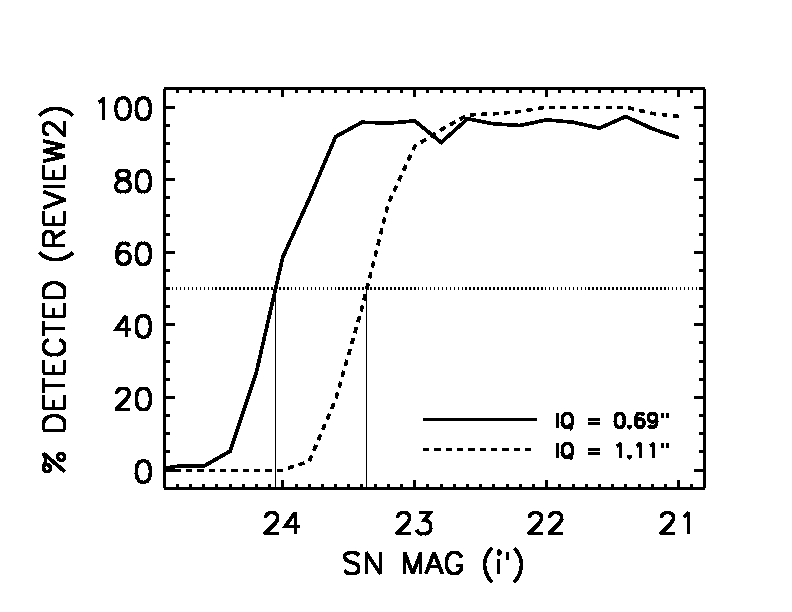
The detection fraction as a function of magnitude for both IQ are plotted below for the review2 cut:
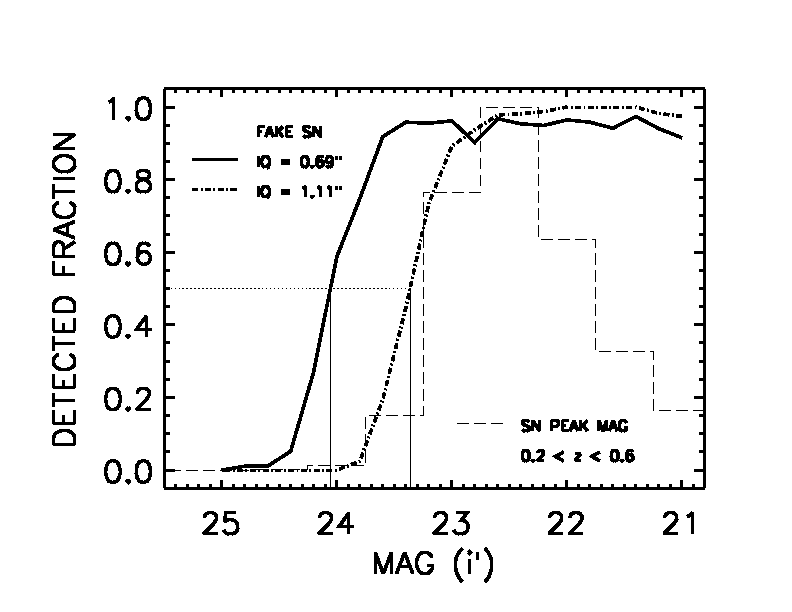
The same detection limit with a histogram of i' peak magnitudes for a simulated Type Ia SN population in the redshift range 0.2 < z < 0.6 overplotted as the dashed line.
The detection limit as a function of IQ derived from the final cut (review2) is plotted below. The histogram of IQ for the control sample time span is overplotted as a dashed line.
Since g' and r' are not used for initial detection, but for light curve fitting, we are only interested in the detection limit from the first cut (findsne2). As above, the histogram of the IQ from the control sample images is overplotted as the dashed line.