Contents
infile='R_2816983974734205722.txt';
P0=0.609210;
T0=55926.891647;
fprintf('Input file is %s\n',infile)
fprintf('Period and zero-phase %f %f\n',P0,T0);
fid=fopen(infile);
A=textscan(fid,'%f %f %f');
fclose(fid);
tmjd=A{1}; magR=A{2}; emagR=A{3};
Input file is R_2816983974734205722.txt
Period and zero-phase 0.609210 55926.891647
Plot the input time series
    figure(1)
    errorbar(magR,emagR);
    title(['Time Series for file: ' infile],'interpreter','none')
    xlabel('sample index')
    ylabel('R mag')
    yl=ylim;

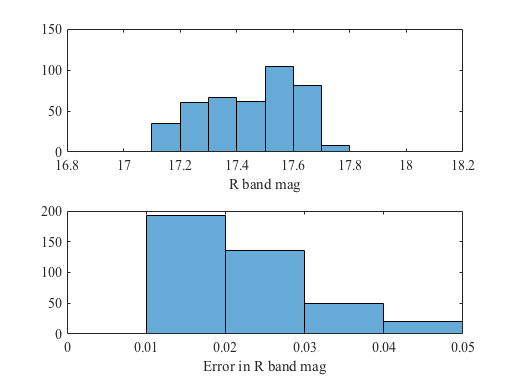
    figure(2)
    subplot(2,1,1)
        histogram(magR);
        xlabel('R band mag')
    subplot(2,1,2)
        histogram(emagR,0.0:0.01:0.05);
        xlabel('Error in R band mag')

    V=var(magR);
    E=mean(emagR.^2);
    medemag=median(emagR);
    fprintf('Variance V=%f   Mean of error-squared E=%f\n',V,E);
    fprintf('Median of mag error %0.3f\n',medemag);
    if(V>E), fprintf('V>E: Variable source\n'),end;
Variance V=0.028257   Mean of error-squared E=0.001159
Median of mag error 0.021
V>E: Variable source
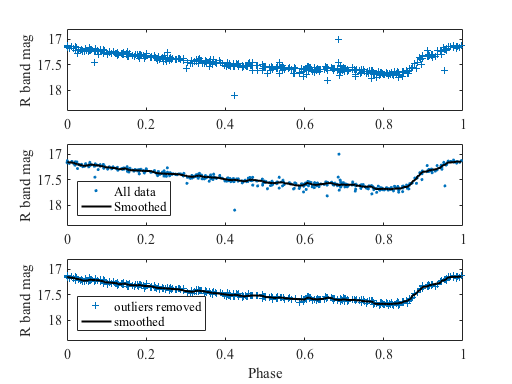
figure(3)
subplot(3,1,1)
phase=mod(tmjd-T0,P0)/P0;
plot(phase,magR,'+')
ylim(yl)
axis ij
ylabel('R band mag')
subplot(3,1,2)
[ph,ind]=sort(phase);
mag=magR(ind);
plot(ph,mag,'.')
hold on
smag=smooth(mag,20,'rloess');
plot(ph,smag,'-k','LineWidth',2)
ylim(yl)
axis ij
ylabel('R band mag')
legend('All data','Smoothed','Location','SouthWest')
hold off
subplot(3,1,3)
dy=smag-mag;
ind=abs(dy)>2*medemag;
n=numel(ind);
m=sum(ind);
fprintf('eliminated %d points out of %d\n',m,n);
mag(ind)=[];
ph(ind)=[];
plot(ph,mag,'+')
hold on
smag=smooth(mag,10,'rlowess');
plot(ph,smag,'-k','LineWidth',2)
axis ij
hold off
legend('outliers removed','smoothed','Location','SouthWest')
xlabel('Phase')
ylabel('R band mag')
ylim(yl)
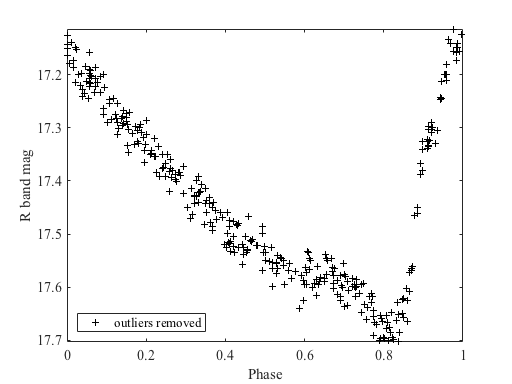
figure(4)
plot(ph,mag,'+k')
hold on
axis ij
legend('outliers removed','Location','SouthWest')
xlabel('Phase')
ylabel('R band mag')
ylim([-Inf Inf])
hold off
eliminated 71 points out of 419