Past Events
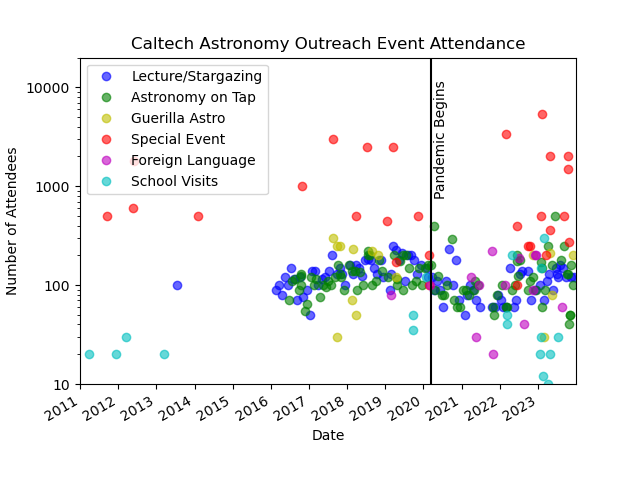
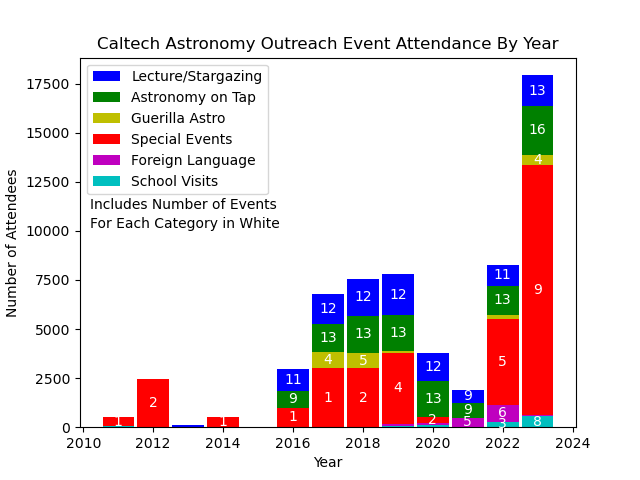 Attendance plots (updated December 2019) are generated and updated periodically using the outreach attendance python script
For photos of all past events, see our Flickr Page
To learn more about each of our past events (including abstracts, titles, etc.), click on the links below. Link back to home page


| I | Attachment | History | Action | Size | Date | Who | Comment |
|---|---|---|---|---|---|---|---|
| |
caltech_histogram.png | r4 r3 r2 r1 | manage | 41.2 K | 2020-07-02 - 01:41 | OutreachAdmin | |
| |
caltech_timeline.png | r4 r3 r2 r1 | manage | 43.4 K | 2020-07-02 - 01:42 | OutreachAdmin |
Topic revision: r49 - 2020-07-02 - OutreachAdmin

Ideas, requests, problems regarding TWiki? Send feedback