SNLS Projects
Weak Lensing Systematics
Outstanding Issues:
- Improve mass normalization
- Develop Monte Carlo for magnification errors
- Get precise host IDs
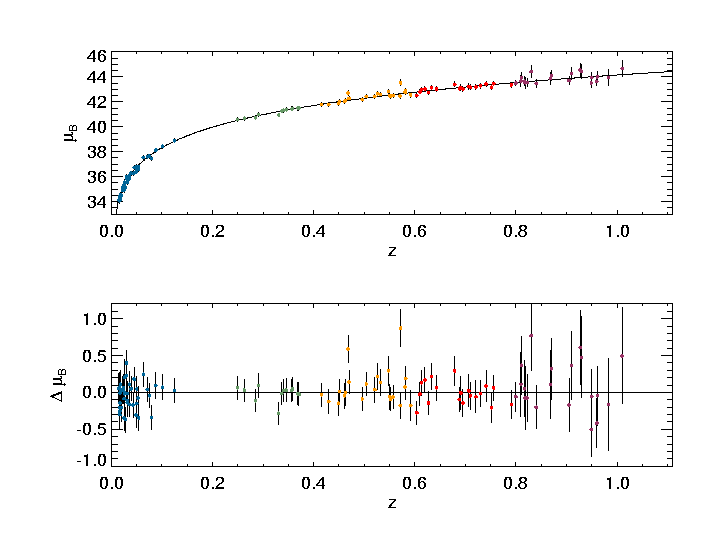
Hubble Diagram and Residuals:

Are these residual correlated with weak lensing magnification? Note that the redshift is color coded. This scheme is also used in the plots below to be sure that what we are seeing is not just due to Malquist bias.
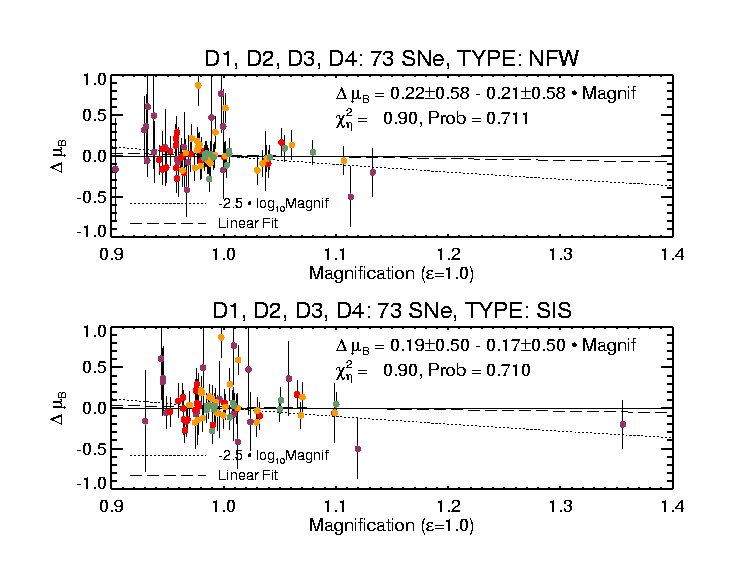
Correlation of Residuals with Predicted Magnification:

Masses and photometric redshifts were derived from the Z-PEG fits of galaxy photometry from deep SNLS stacks in u*, g', r', i', and z'. For each SNLS SN in D1, D2, D3, and D4, we took the derived parameters for each galaxy within a 50 arcsecond radius and input these to the qlet program to derive the weak lensing magnifications plotted above. We used two mass distribution models: the Navarro, Frenk, and White (NFW) model and the Single Isothermal Sphere (SIS) model. Using just the errors in delta mu(B), the reduced chi^2 for both of these fits indicate a reasonable probability that the linear fit is a good model of the data. The fits are plotted as long-dashed lines and the conversion of the magnification factor into magnitudes is plotted as a dotted line.
SN Line-of-Sight Plots
The actual galaxy distribution is plotted around each SN with the redshift for the most massive galaxies annotated. The magnifications predicted by the two mass distribution models are listed at the bottom of the plots