Host Extinction
We performed three experiments to estimate the systematic errors associated with
host extinction. First, we calculated rates using no host extinction at all,
and then we used an exponential dust distribution with scale parameters of
lambda=5, and 3.
r_V = 0.35 +- 0.07	-20.5%	1.0 sigmas	No Dust
r_V = 0.47 +- 0.10	 +6.8%  0.3 sigmas	Exponential Dust (lambda = 5.0)
r_V = 0.59 +- 0.12	+34.1%  1.7 sigmas	Exponential Dust (lambda = 3.0)
The No Dust experiment reduces our rate by 20% and thus illustrates the effect of assuming no host extinction. Clearly there is host extinction, so we can assume that our systematic errors are much less than -20%. Our canonical distribution was based on the observed color distribution of SNe Ia from Astier et al. (2005). If a bias has occured, it is toward missing extincted SNe. We therefore assume that our bias due to host extinction is one-sided.
The exponential dust experiments place a limit on the systematic errors of +34%. We consider this an upper limit since the distribution with lambda=3.0 is only appropriate for high inclination disk galaxies (see below), which cannot be the majority of SN Ia hosts.
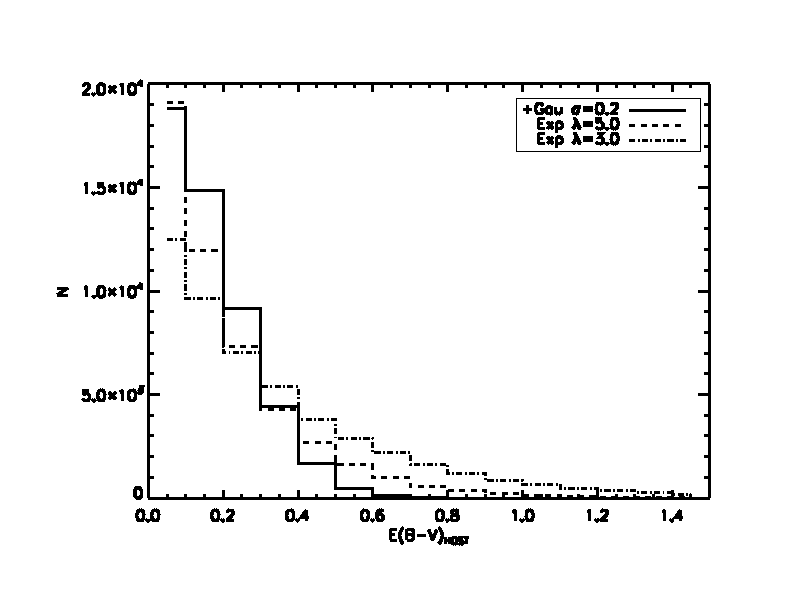
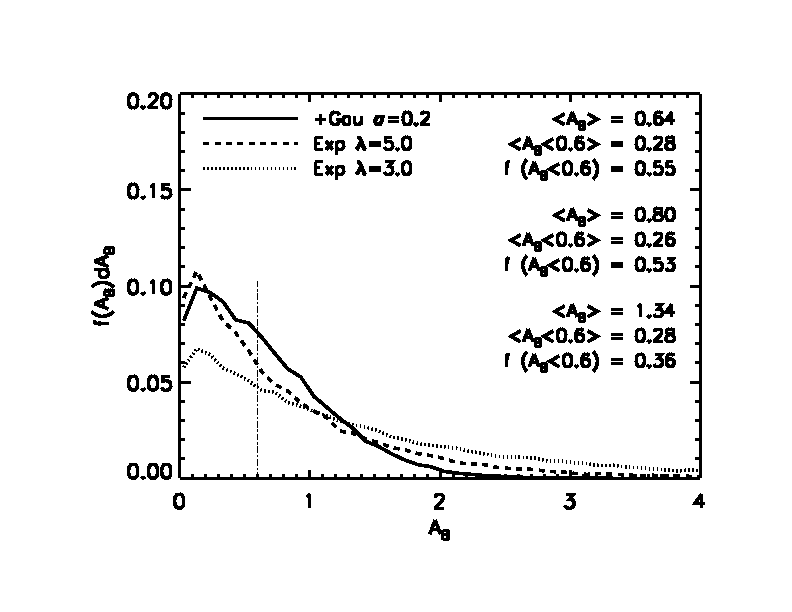
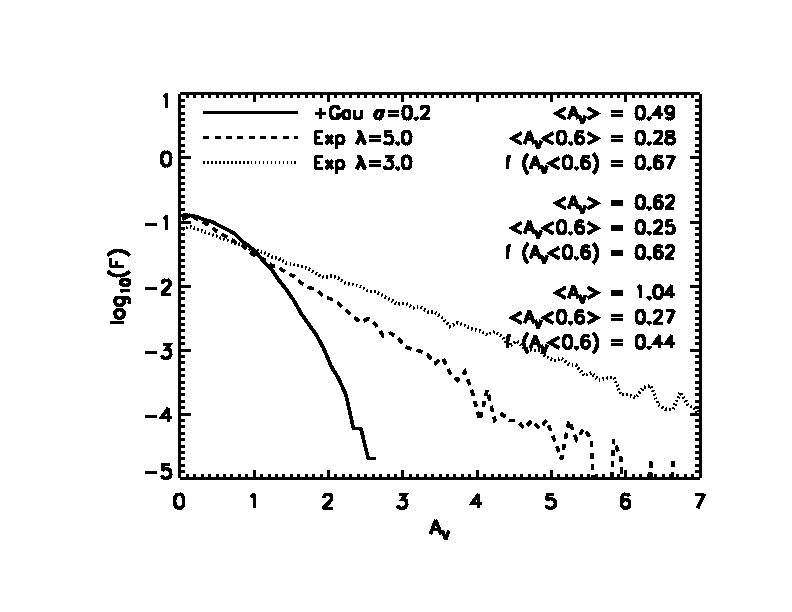
Below is a plot of the distributions in E(B-V), A(B) and A(V) from our canonical and exponential E(B-V) distributions. We can compare these with the model distributions from HBD98 and Riello & Patat (2005) (link).


Below are the parameters characterizing the A(B) and A(V) distributions
from the models of HBD98 and Riello & Patat (2005) that are closest to
those from our distributions:
HBD98

cos(i)  AVG(A_B)  AVG(A_B lt 0.6)  f(lt 0.6)            distribution
0.50      0.58     0.14             0.55                canonical
0.25      1.17     0.13             0.43                Exp l=5.,3.

Riello & Patat (2005)

incl	AVG(A_V)  AVG(A_V lt 0.6)  f(lt 0.6)   BT       distribution
60 - 75   0.41     0.15             0.77       0.0      canonical
60 - 75   0.54     0.14             0.69       0.3      Exp l=5.
75 - 90   1.24     0.16             0.56       0.0      Exp l=3.

Note: BT is bulge to total ratio with BT=0.0 being a pure disk
galaxy and BT=1.0 being pure bulge (elliptical).
The exponential distributions appear more appropriate for the higher
inclination disk galaxies from HBD98 and Riello & Patat. We, therefore,
conclude that the upper limit for the systematic from dust extinction
errors is +34% or +0.15.
For this source of systematics, we altered the SN detectability equation and
re-ran our efficiency experiments. We used the alpha(f) parameter from the
r' in the equations for the g' and i' detectability and re-calculated the rates.
Plots of showing the fits of alpha(f) can be seen here
(toward the bottom of the page).
Thus, our systematic error from our frame limits we estimate to be +- 0.04.
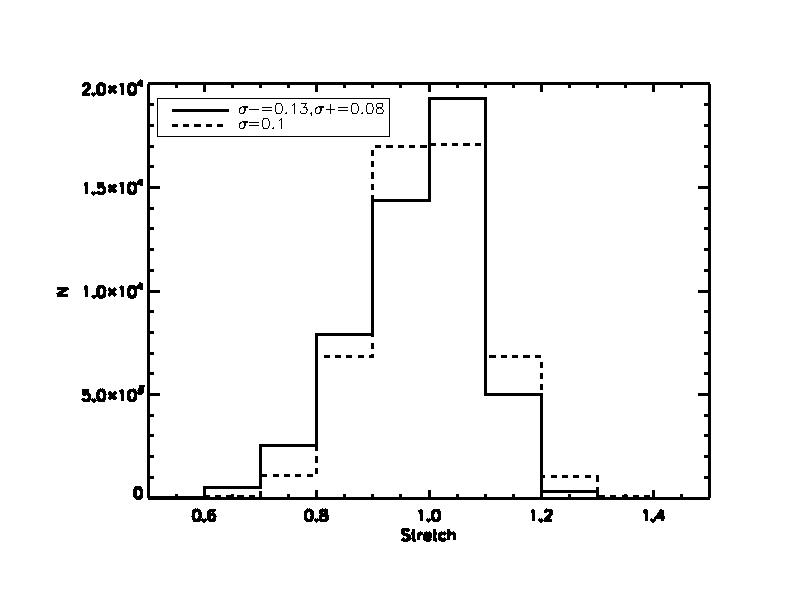
We tested our stretch distribution by using a symmetric Gaussian with a
sigma width of 0.1, but requiring the stretch be between 0.6 and 1.4.
The figure below compares the canonical stretch distribution with the
tested distribution.
The result is that the difference is very small and contributes a negligible
amount to the systematic errors in the rates.
Frame Limits
r_V = 0.40 +- 0.08 -9.1% 0.4 sigmas Frame limits
Stretch
r_V = 0.43 +- 0.09 -2.3% 0.1 sigmas Stretch

Last updated, 26 Aug 2005
Please send questions or comments to Don Neill at
neill@uvic.ca