The following images demonstrate the quality of the OVRO 40m 15 GHz light curves.
Data examples
Calibrators
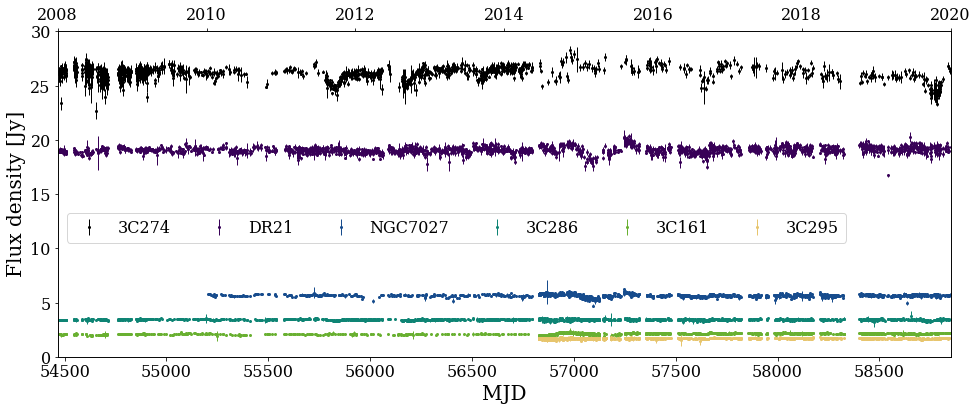
3C286 and DR21 are the usual flux density calibrators. The absolute calibration error is about 5% of the total flux density. The observations and data reduction are described in Richards et al. 2011, ApJS, 194, 29. The following figure and the data shown therein are not allowed to be used in publications without explicit permission given by the OVRO 40m team.
Recently published light curves
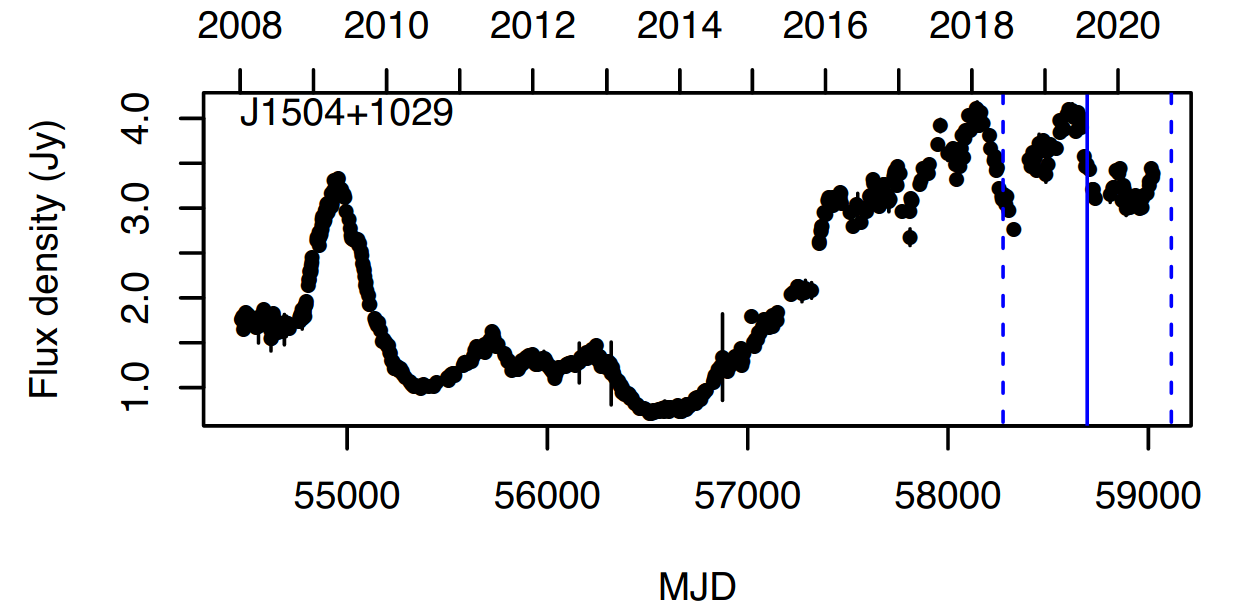
OVRO 15 GHz light curve of PKS1502+106 (black dots) as shown in Figure A.2 in
Hovatta et al. 2020, accepted in A&A.
The blue solid line highlights a Neutrino event originating from a sky region that includes PKS1502+106, which is showing strong flaring activity at 15 GHz during this period.
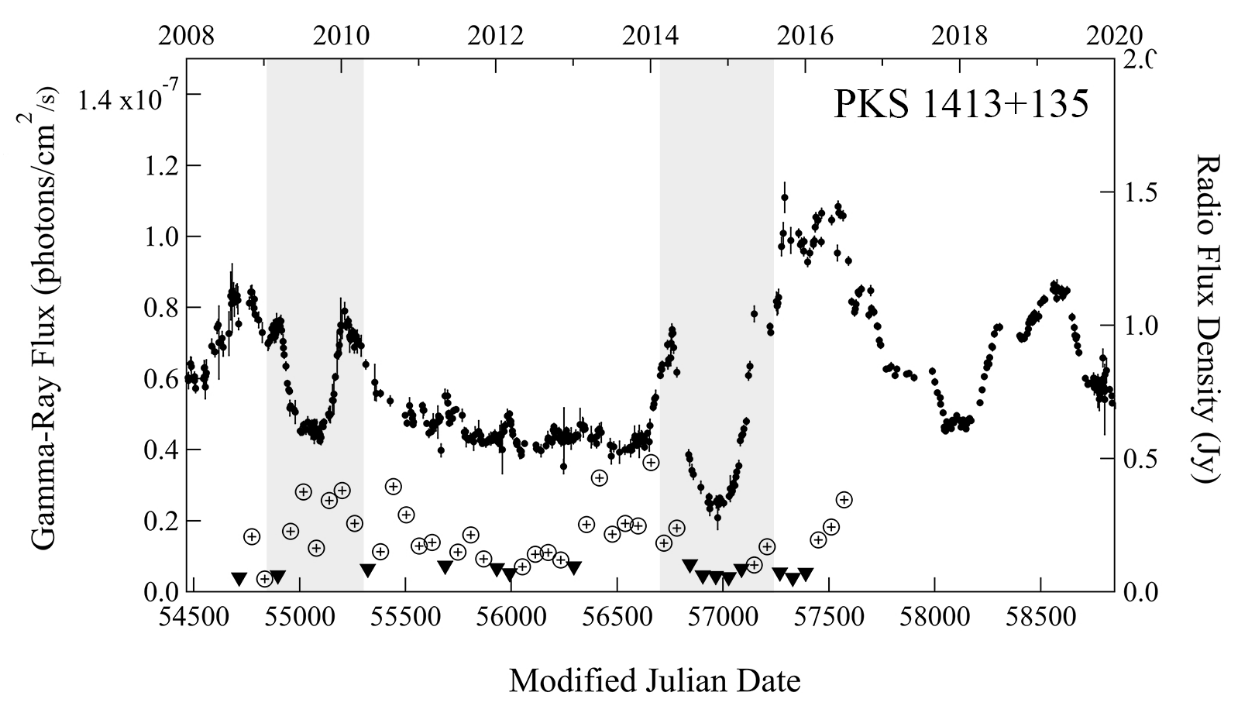
OVRO 15 GHz light curve of PKS1413+135 (black dots) as shown in Figure 11 in Readhead et al. 2020, accepted in ApJ.