|
Please click on images for larger versions.
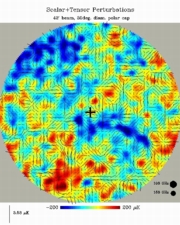
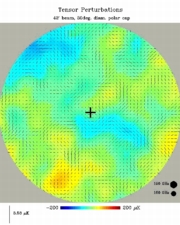
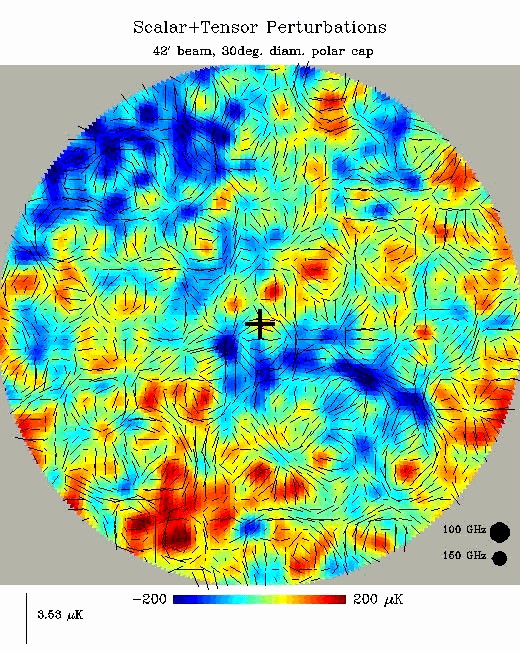
Figure 1: A simulated 30° diameter map of the CMB polarization superimposed on the CMB temperature anisotropy centered on the South Celestial Pole. The top panel shows the total polarization field due to the sum of the scalar and tensor modes, with T/S - 0.28. The lower panel shows the tensor modes alone. The angular resolution of BICEP is shown in the lower right corner of each panel.
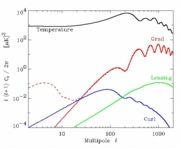
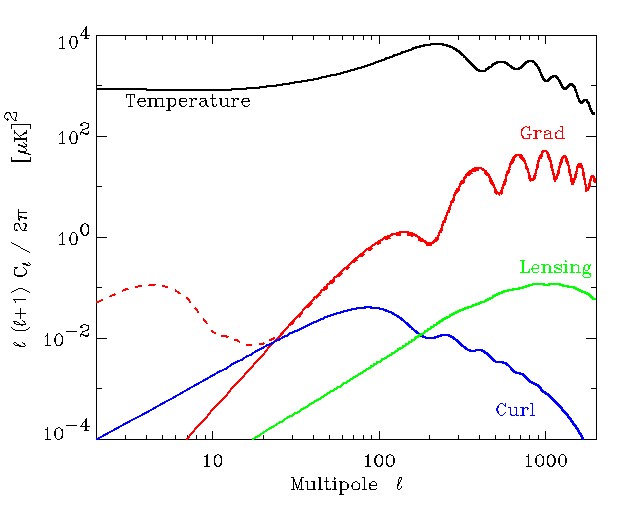
Figure 2: The spatial power spectra of CMB temperature anisotropies (black), grad polarization (red), and curl polarization due to the GWB (blue) and due to the lensing of the grad mode (green), all assuming a standard CDM model with T/S = 0.28. The dashed curve indicates the effects of reionization on the grad mode for tau = 0.1.
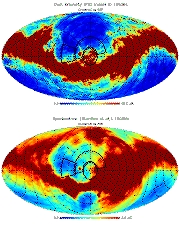
Figure 3: Maps of galactic dust intensity and sychrotron polarization extrapolated to 100 GHz. The trapezoid regions indicate the BOOMERANG field and the circular and half-annular regions indicate the coverage for BICEP.
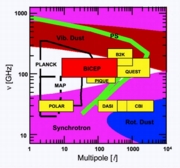
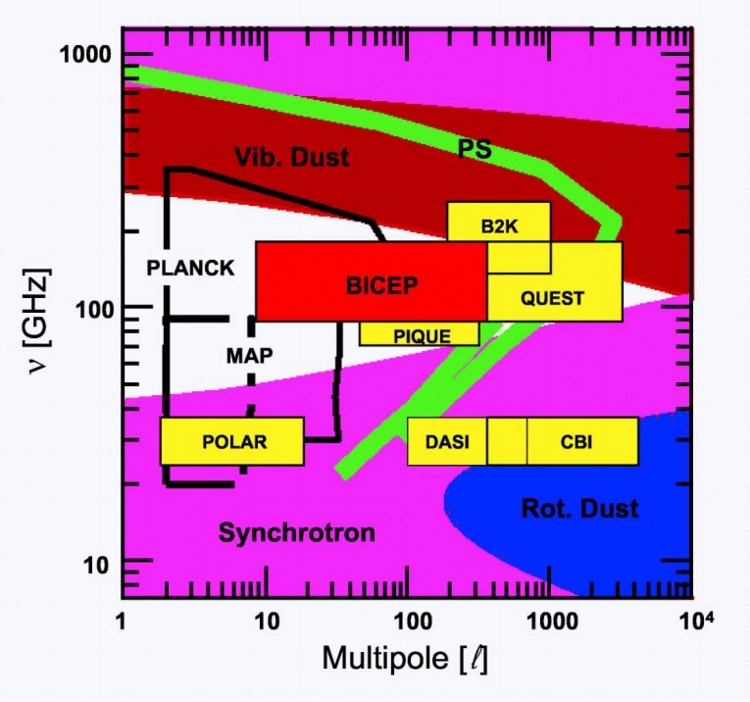
Figure 4: Comparison of estimated polarized foregrounds from synchrotron (magenta), vibrational dust (red), rotational dust (blue), and point source emission (green) from the "middle of the road" Tegmark et al. (1999) model. The shaded regions indicate where the foregrounds contribute more than 0.8 µK.
|
BICEP (Background Imaging of Cosmic Extragalactic Polarization) is an experiment designed to measure the polarization of the cosmic microwave background (CMB) to unprecedented precision, and in turn answer crucial questions about the beginnings of the Universe. It will operate at 100 GHz and 150 GHz at angular resolutions of 1.0° and 0.7°, respectively, with an array of 96 polarization-sensitive detectors, mapping a large region of the sky around the South Celestial Pole.
Recent CMB observations have hinted strongly at an inflationary epoch in which the size of the universe undergoes rapid exponential expansion during the first 1e-38 seconds, producing the near isotropy of the horizon, the flat geometry of the universe, and the pattern of peaks and valleys in the CMB power spectrum that we observe today. Although these recent observations are consistent with the inflationary model, they are not sufficient to rule out other models of the early universe. The critical remaining test is to detect the gravity-wave background (GWB), which is only predicted by inflation, and the most promising means of accomplishing that is to look for the GWB's imprint on the polarization of the CMB.
A given polarization distribution on the sky can be decomposed into a gradient component and a curl component, just as a regular vector field can be expressed as a sum of a gradient term and a curl term. This is useful since scalar perturbations produce zero curl (grad) component, whereas the GWB produces a non-zero curl component, providing a clean and efficient way of separating the signature of the GWB from the larger polarization signal due to scalar perturbations. (See Figure 1.)
GWB's extremely faint imprint on the CMB polarization combined with various foreground and instrumental sources of confusion makes this a difficult task. One source of confusion is from the gravitational lensing of the CMB polarization due to foreground sources. The process of lensing converts some of the grad component into a curl component, giving a false GWB signal (see Figure 2). Two other major sources of contamination are the galactic dust and synchrotron polarized emissions. One difficulty is the lack of understanding of these two sources in the millimeter wavelengths. The correlation between dust intensity and polarization is poorly understood, and synchrotron emission must be extrapolated from 1-3 GHz to frequencies in the range of 100 to 150 GHz. (See Figure 3.) The BICEP instrument will have a flexible and easily upgradeable design which will allow for optimization after the first season of observation, when these foreground sources will be better characterized.
The above-mentioned sources of confusion and others can be mitigated by carefully selecting the angular resolution, frequencies of operation, and scanning strategy. Figure 4, comparing various experiments in the frequency-multipole space, shows that BICEP is well-situated to make the cleanest-possible detection of the GWB.
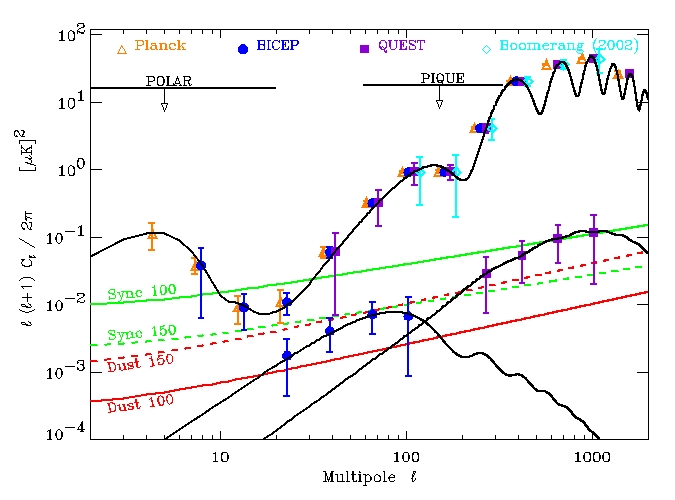
Figure 5 compares the capabilities of Plank, BICEP, QUEST, and BOOMERANG/2002 (B2K2). BICEP will probe for the GWB due to Inflation more deeply than Plank. Here we plot (solid black) the grad-mode (upper curve) and GWB-induced curl-mode (lower curve) polarization spectra corresponding to tau = 0.1 and T/S = 0.05, respectively. Estimates of polarized foreground confusion are shown for synchrotron (green) and dust (red) emission at 100 GHz (solid) and 150 GHz (dashed). The GWB signature peaks at l ~ 90 (~ 2° on the sky). Also shown are current upper limits (1 sigma) and estimates of the sensitivity to the grad and curl-modes for:
Plank (1 year / 143 GHz 8 detectors / 80 µK_cmb per 7' x 7' pixel over 100% of sky)
BICEP (300 days / 150 GHz 96 detectors 280 µK_cmb per 0.7° x 0.7° pixel on a useful 3.4% of sky) QUEST (2000 hours total / 12 feeds with 6' resolution, 19 feeds with 4' resolution / 350 µK_cmb per polarization component per pixel on 0.15% of sky)
B2K2 (8 days / 140 GHz only / 0.8 µK_cmb per 1° x 1° pixel on a useful 0.1% of sky)
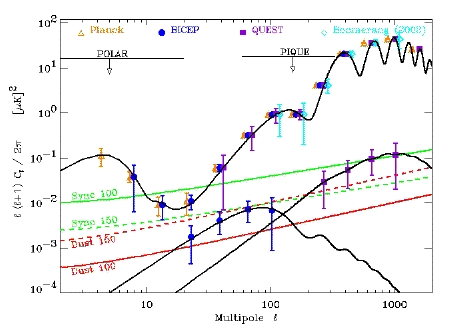
Figure 5: A comparison of sensitivities of BICEP and other experiments.
|