
|
|
|
DBSP Throughput Curves
Abstract
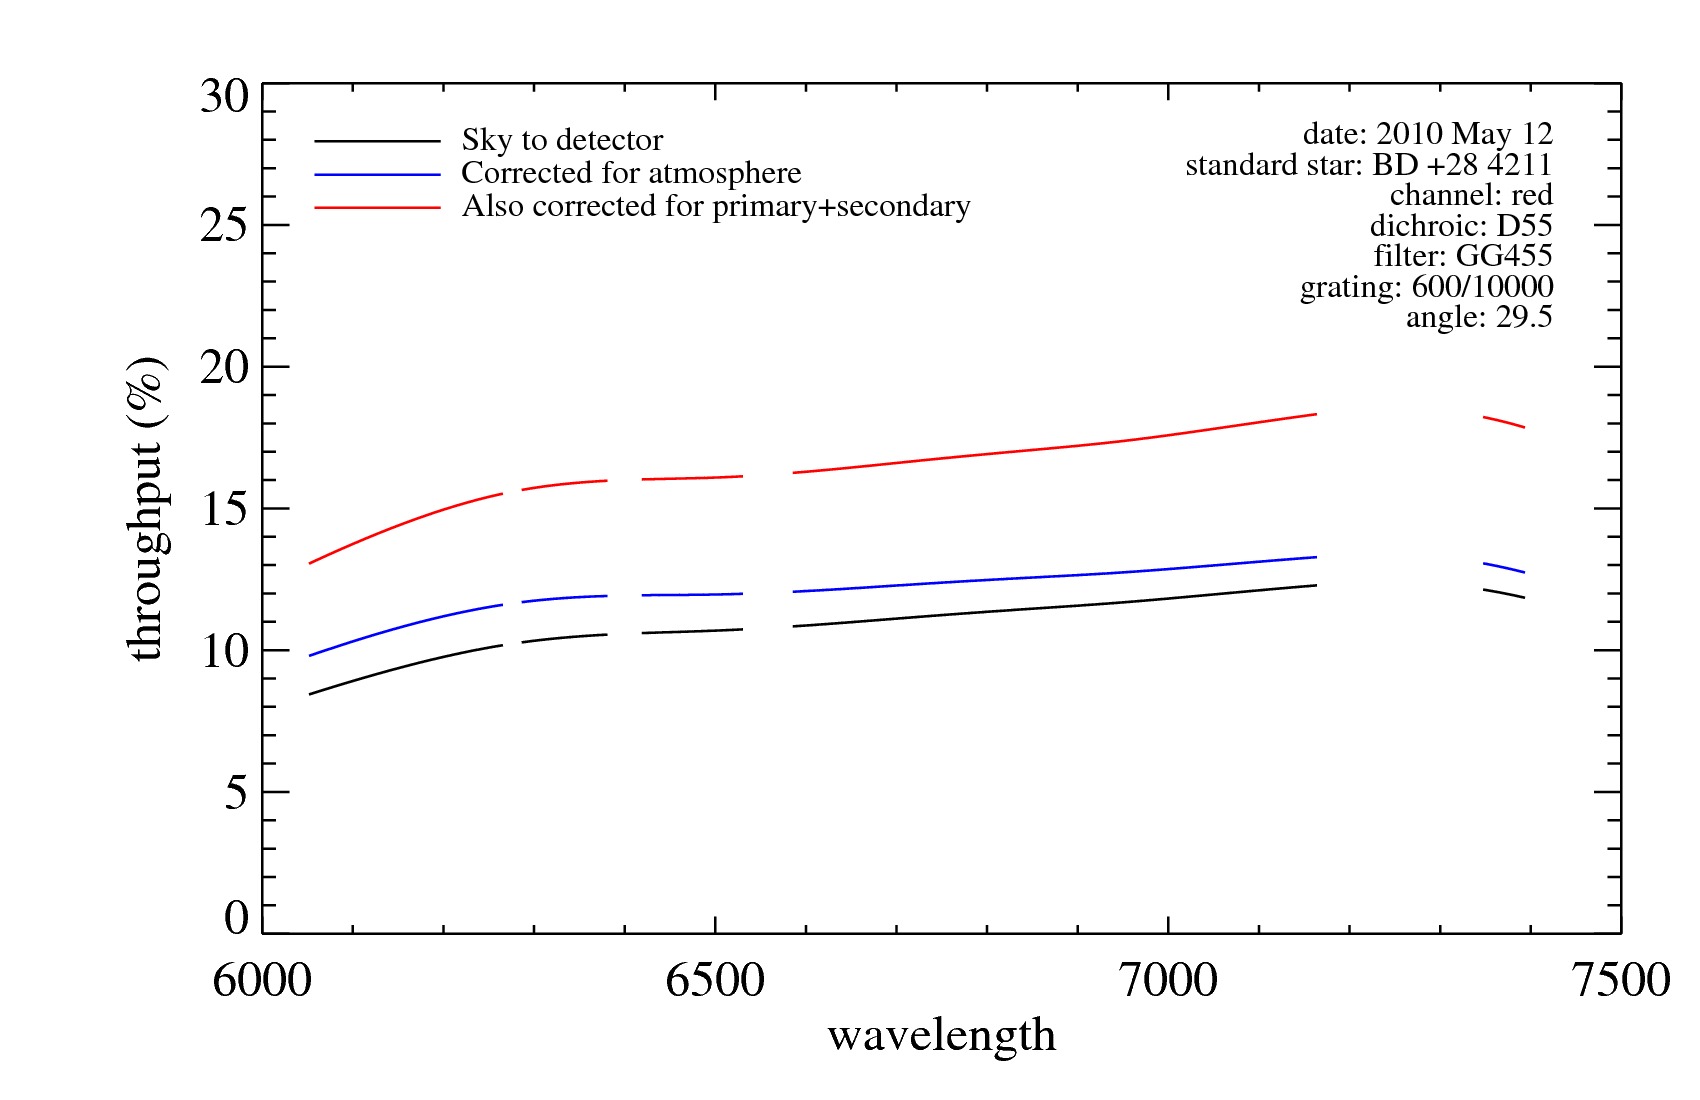
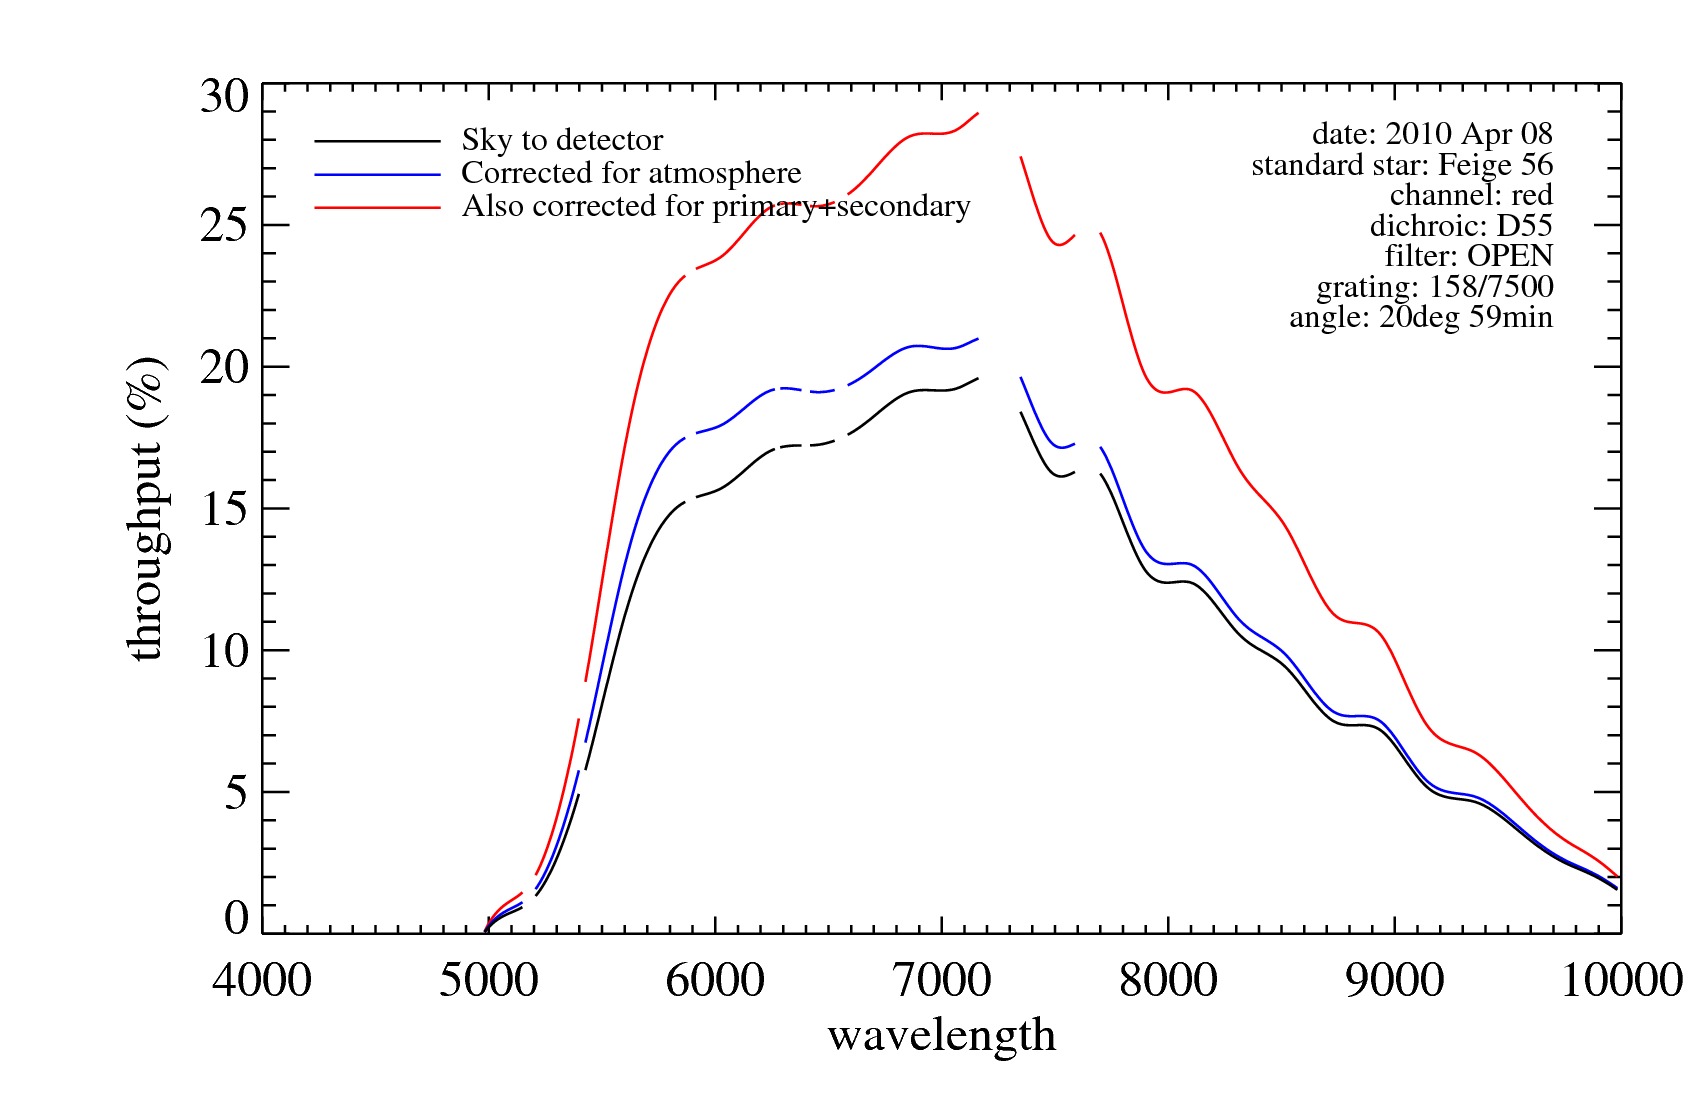
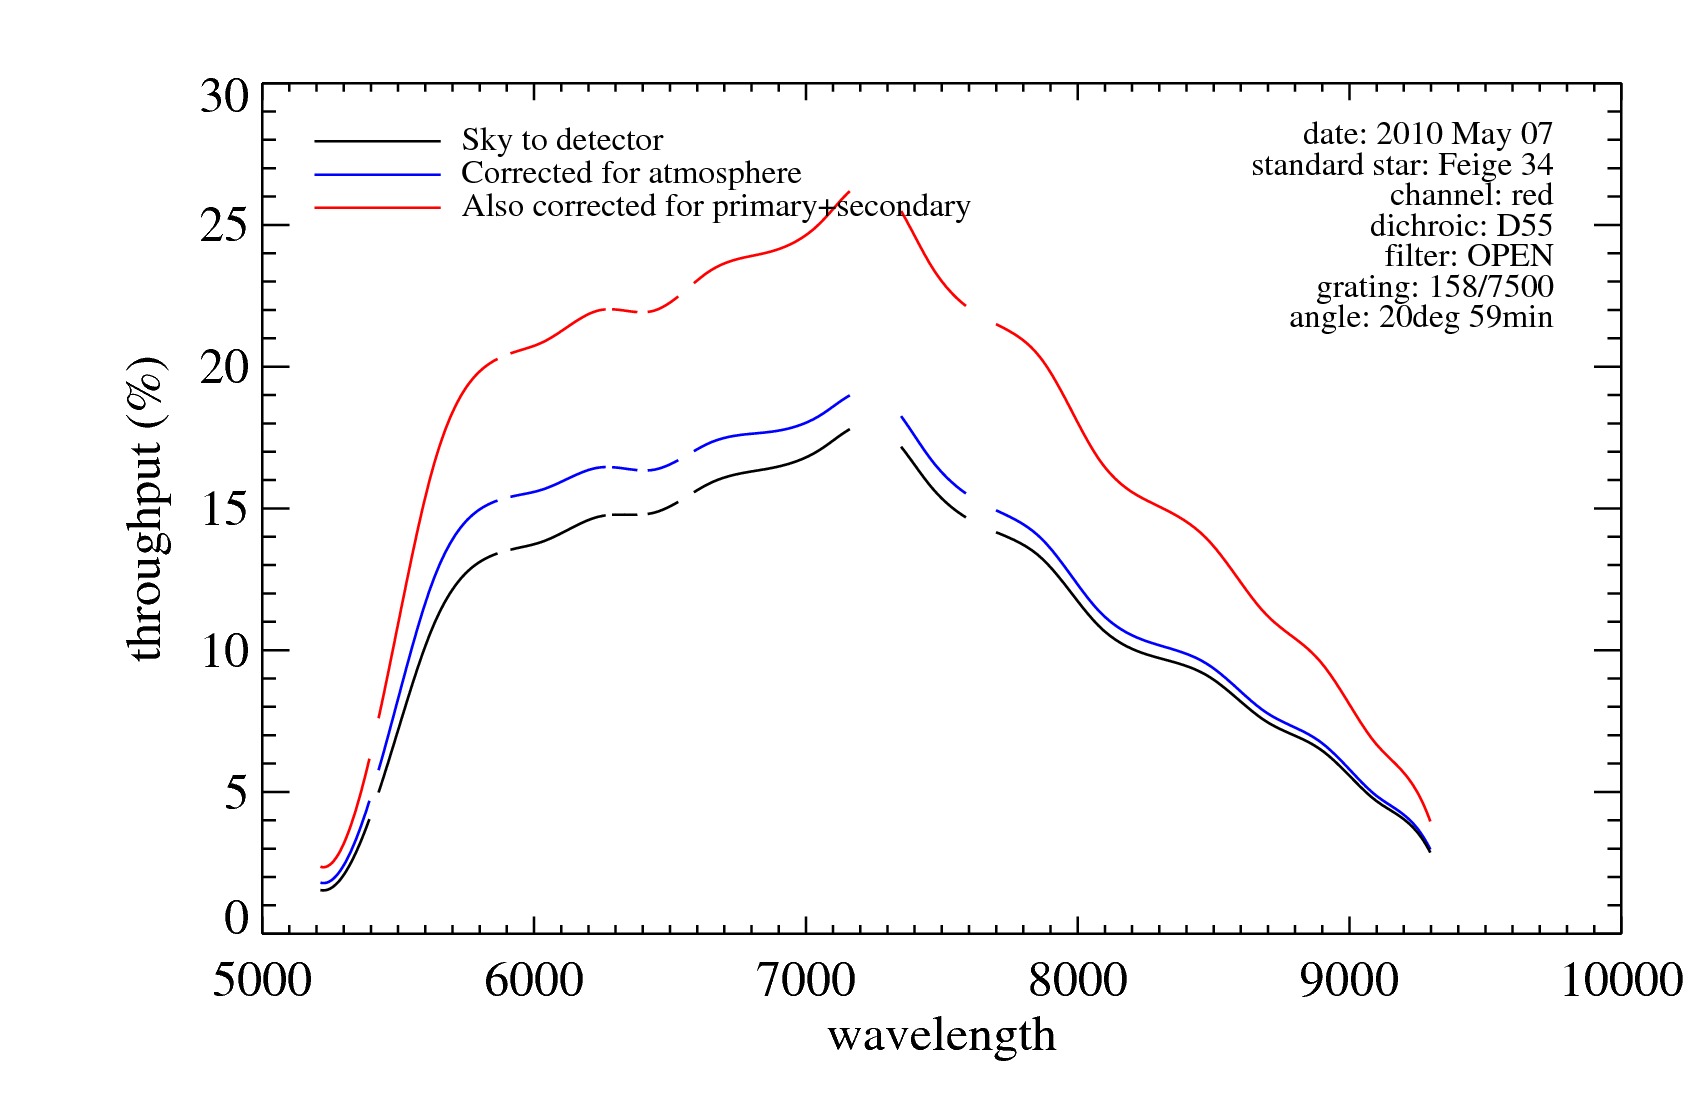
Red channel DBSP throughput curve for the 600/1000 grating/D55 dichroic filter combination at a grating angle of 29.5°. (Palomar/Caltech)
This page reports on estimated Hale Telescope Double Spectrograph (DBSP) throughput in various configurations based on spectrophotometric standard data taken in 2010. These data were acquired prior to the red side CCD upgrade (late 2011) and will be updated to current values in the near future. The blue side is not expected to change appreciably. Estimated throughput curves are shown for both the red and blue DBSP channels and for a representative set of spectrograph configurations. Throughput dependence on gratings, grating angles, and the dichroic filter are illustrated in these results. Observation, reduction, and throughput estimation procedures are described below.
Evan Kirby calculated the throughput curves and wrote this page. Thanks to Jeff Hickey and Kevin Rykoski for obtaining the measurements. Special thanks to the DBSP observers in 2010 who sacrificed some dark time to make these measurements possible.
Procedure
- Arc lamps were obtained through a narrow slit. Generally, the FeAr lamp was used for the blue side, and the HeNeAr lamps were used for the red side. However, sometimes the same lamps was used for both sides.
- A convenient spectrophotometric standard was selected from the list of Stone, R. P. S. 1977, ApJ, 218, 767, Massey, P., Strobel, K., Barnes, J. V., & Anderson, E. 1988, ApJ, 328, 315, Massey, P., & Gronwall, C. 1990, ApJ, 358, 344, or Hamuy et al. 1994, PASP, 106, 566.
- Some exposures were obtained through the 10 arcsec-wide slit on a clear night. The number of exposures and exposure time varied depending on the magnitude of the standard star.
- The NOAO/twodspec/longslit/doslit procedure was used to extract and sky-subtract the stellar spectra. The extraction windows were generously wide to keep as much flux as possible.
- The spectra were wavelength-calibrated using the NOIRLab Spectral Atlas Central database of emission line spectra for calibration lamps.
- If applicable, one-dimensional spectra were summed. For the following equation, texp is the sum of exposure times from individual frames.
- The AB magnitudes of the standard star, taken from the above references, were converted to the expected number of photons per wavelength bin: $$N_{photons} = { {t_{exp}} \; A \; \Delta\lambda \; 10^{-0.4(m_{AB} \: + \: 48.60)} \over h\lambda },$$ where A = 1.76 × 105 cm2, which is the collecting area of the Palomar primary mirror, and h is Planck's constant. Both Nphotons and mAB are functions of wavelength.
- The total sky-to-detector throughput is given by the quotient of the measured number of photons and the expected number of photons.
- The extinction due to the atmosphere was corrected according to the Palomar extinction curve (Hayes & Latham, ApJ, 197, 593). These magnitudes are tabulated for an airmass of 1. Therefore, the extinction magnitudes were multiplied by the airmass of the standard star at the time of observation.
- The reflectivity losses due to two mirror reflections (primary and secondary) were corrected according to the reflectivity coefficients of aluminum (Weaver & Frederikse, Handbook of Chemistry and Physics, 12-126). The coefficients were renormalized to 86% at 6700 Å.
Throughput Curves
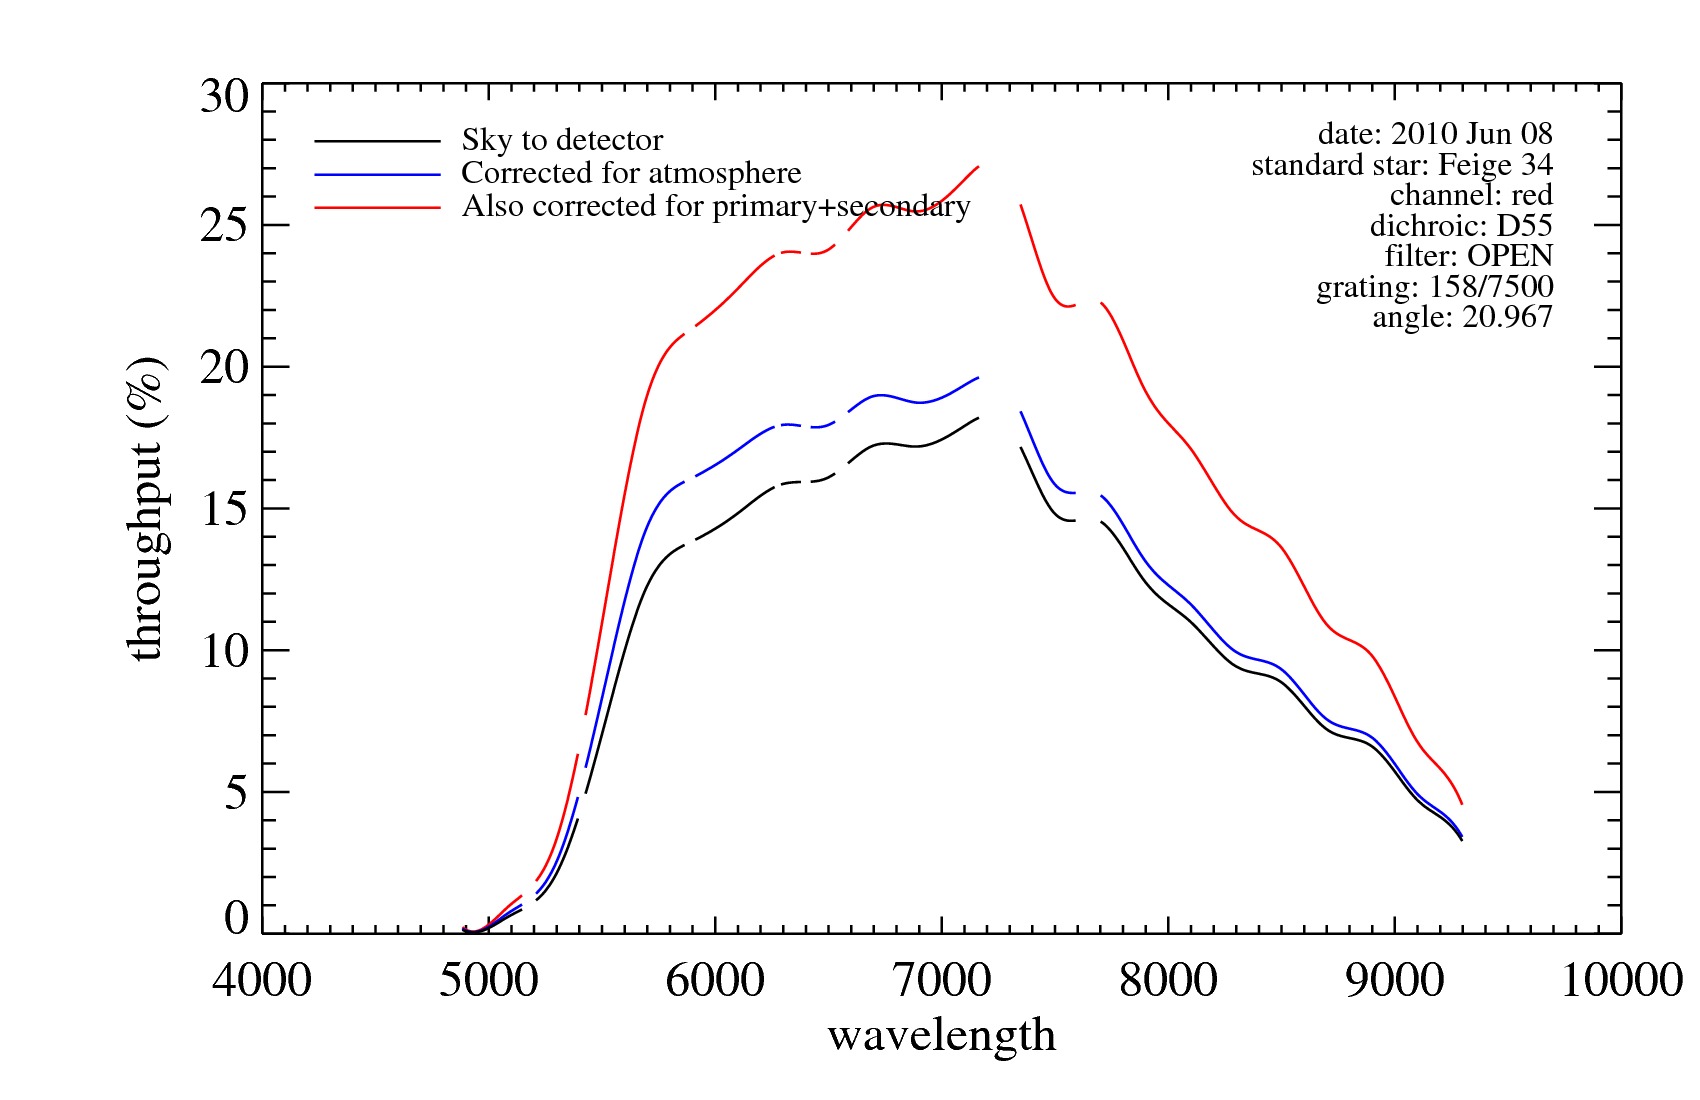
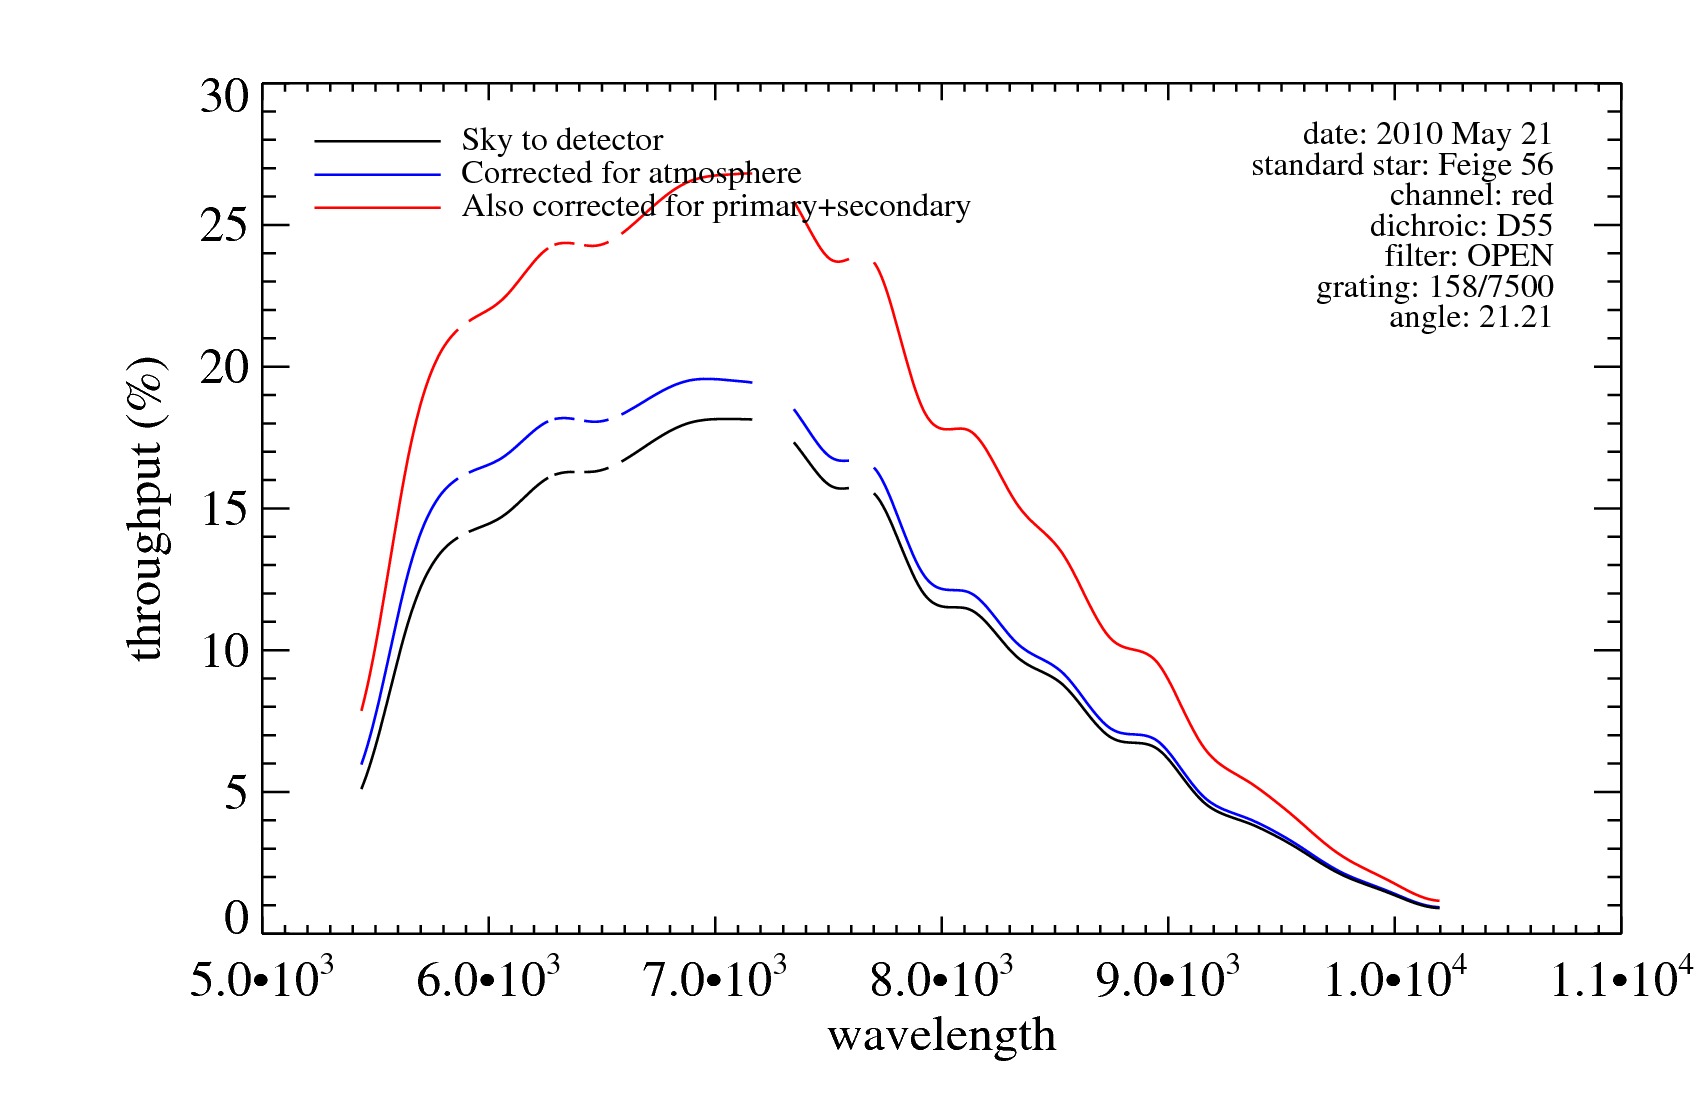
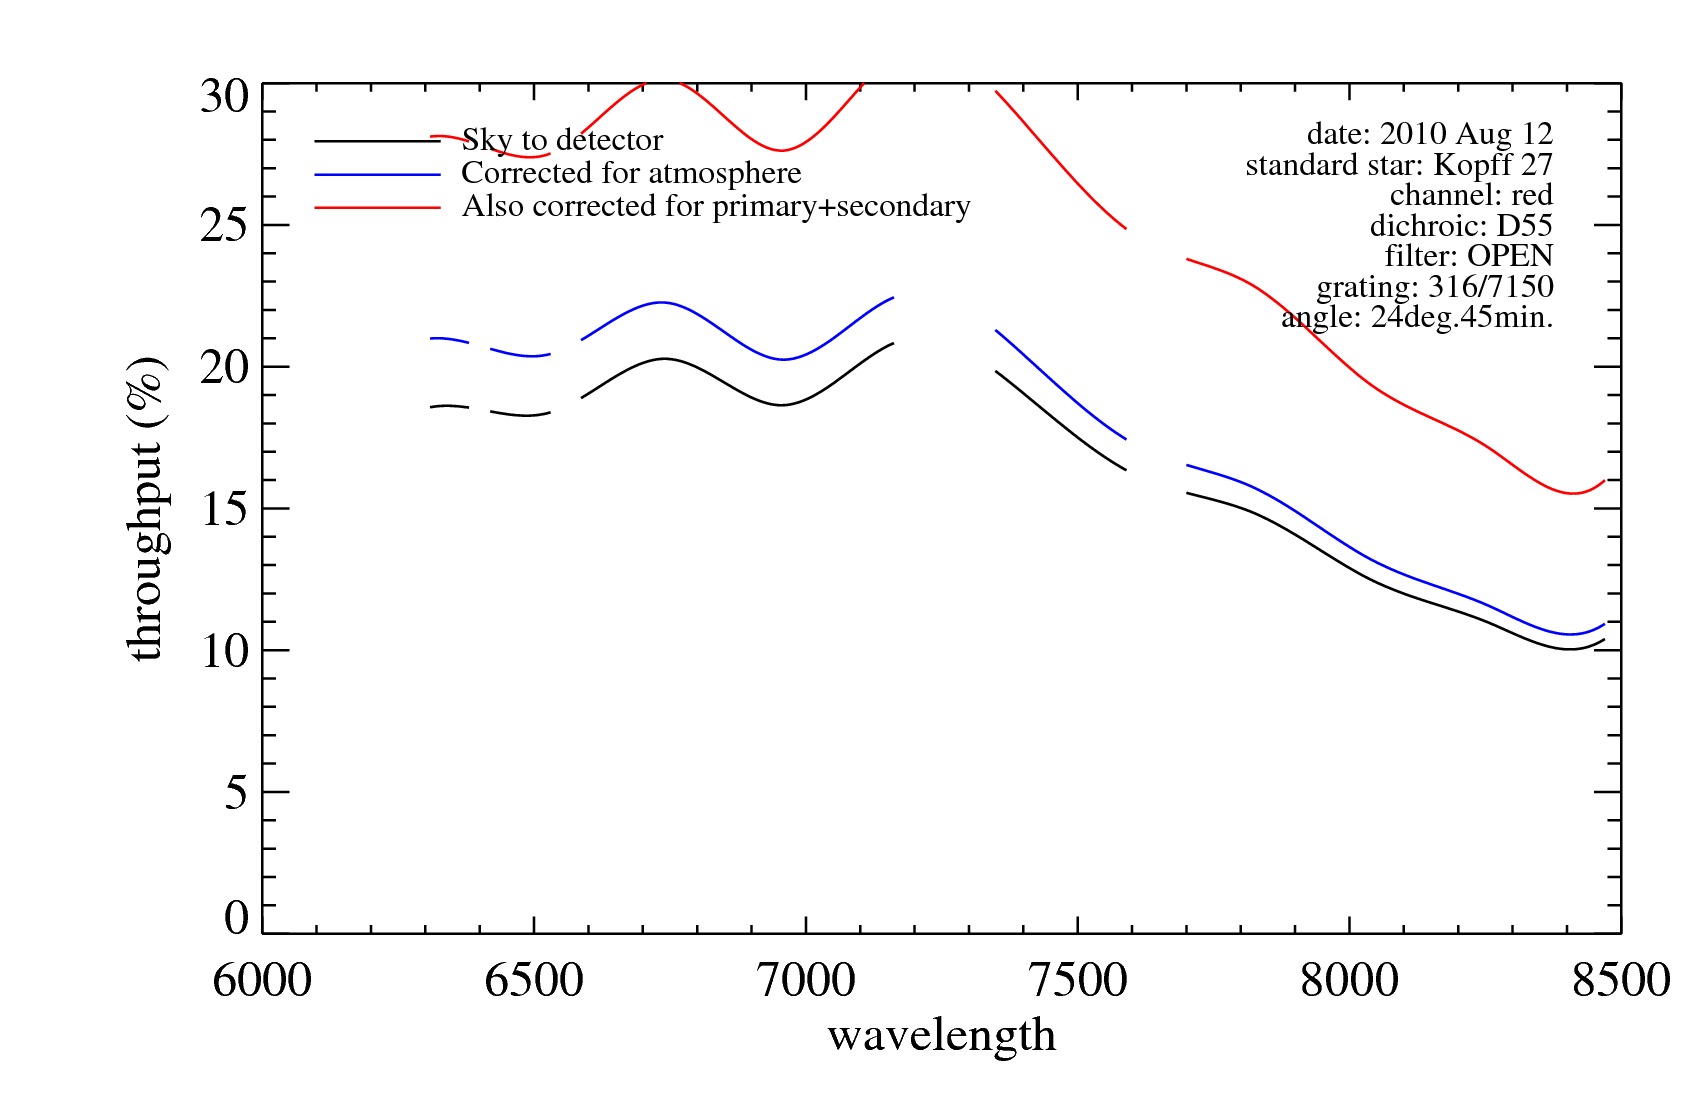
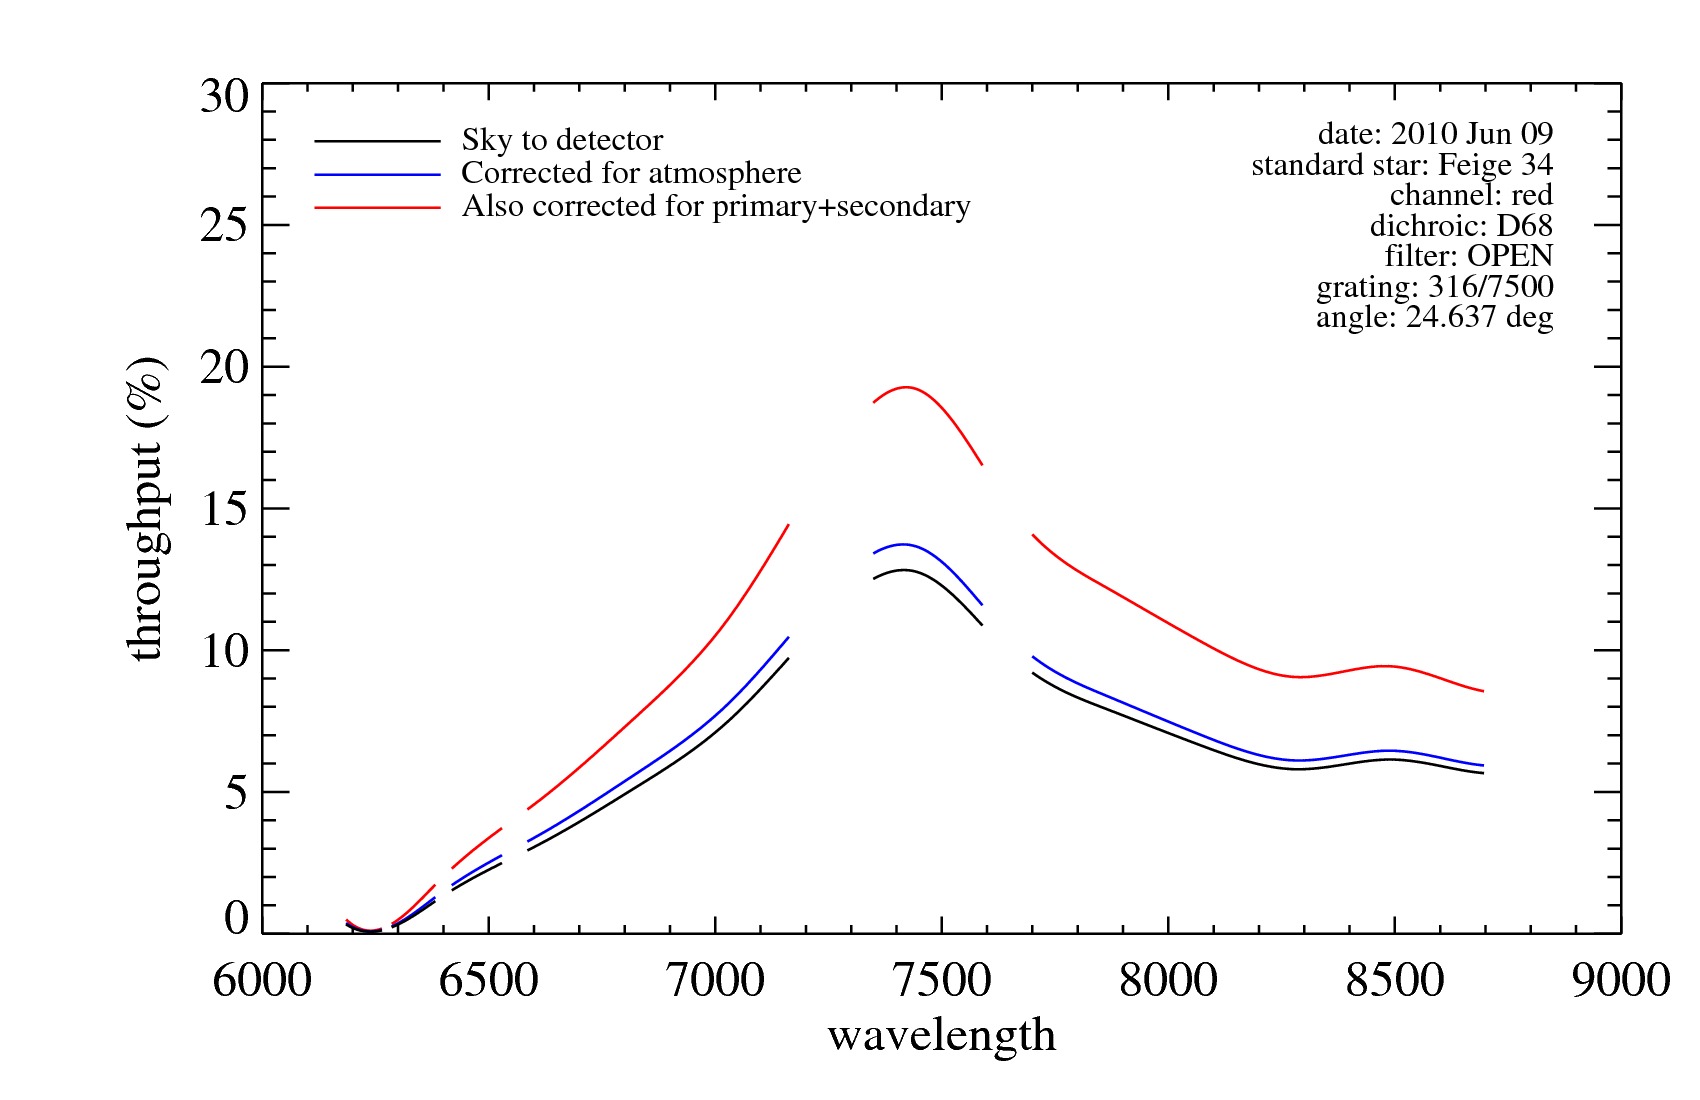
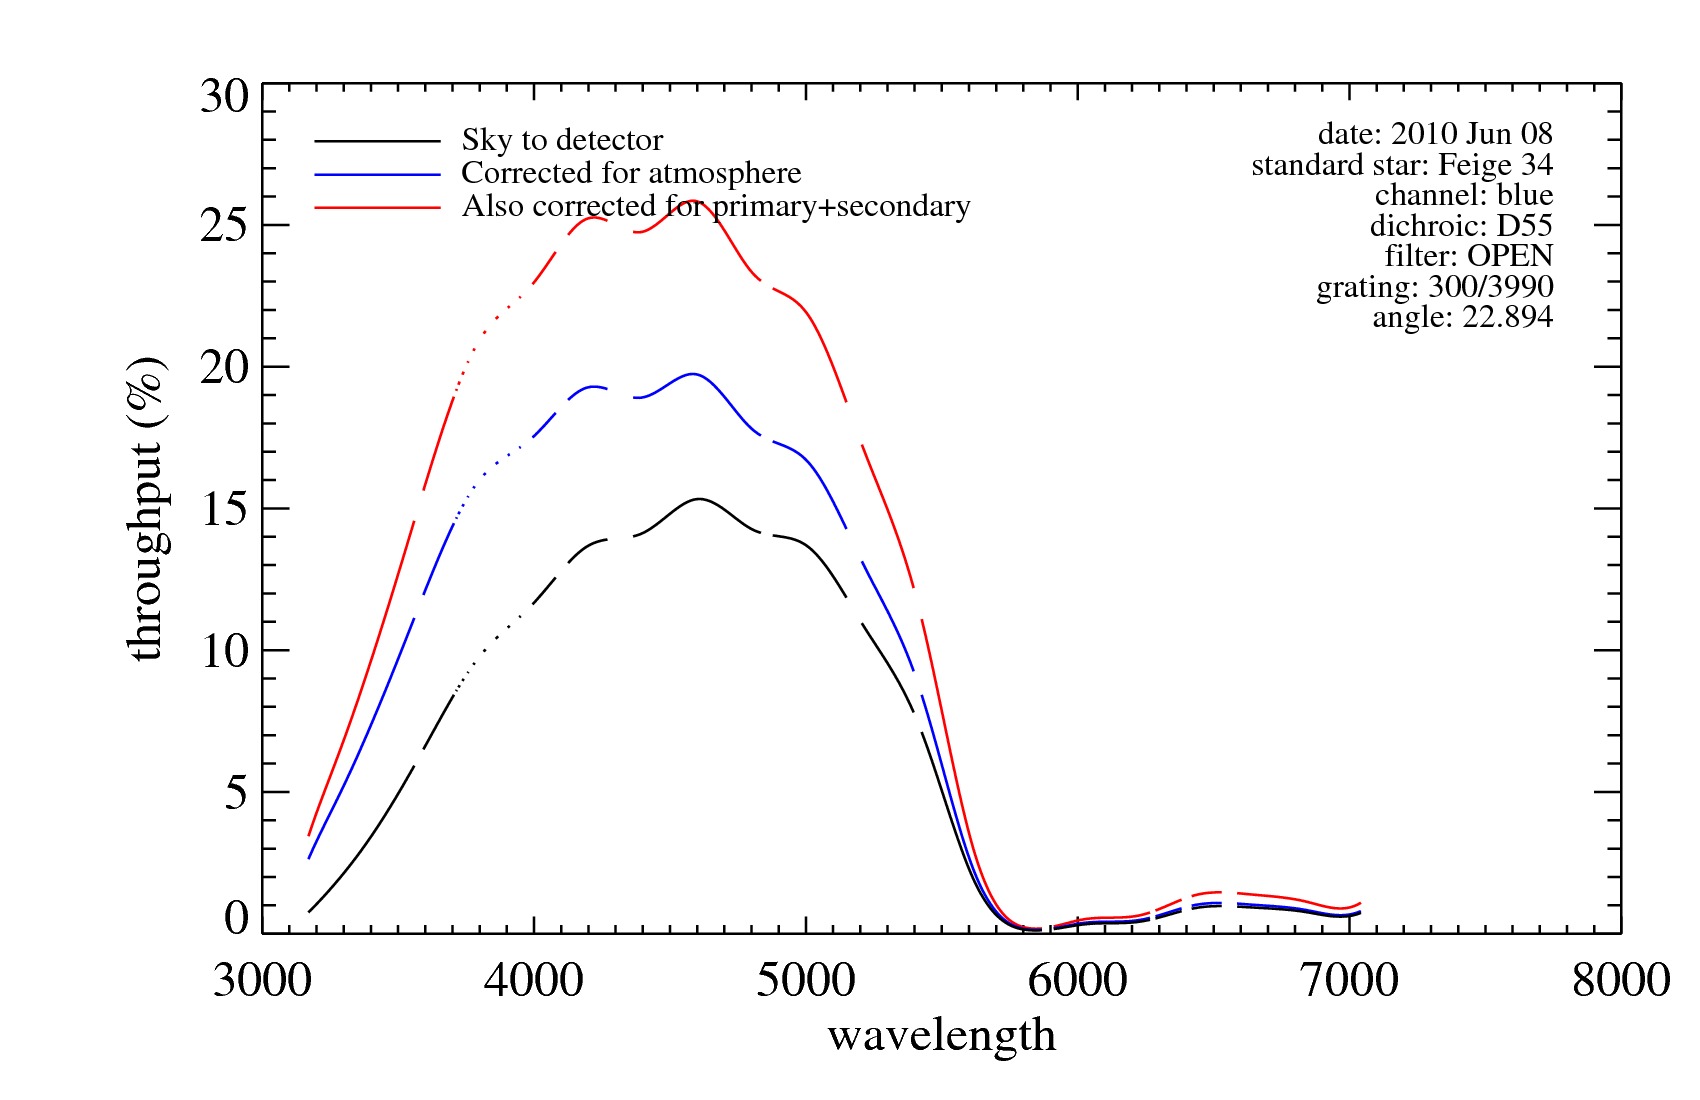
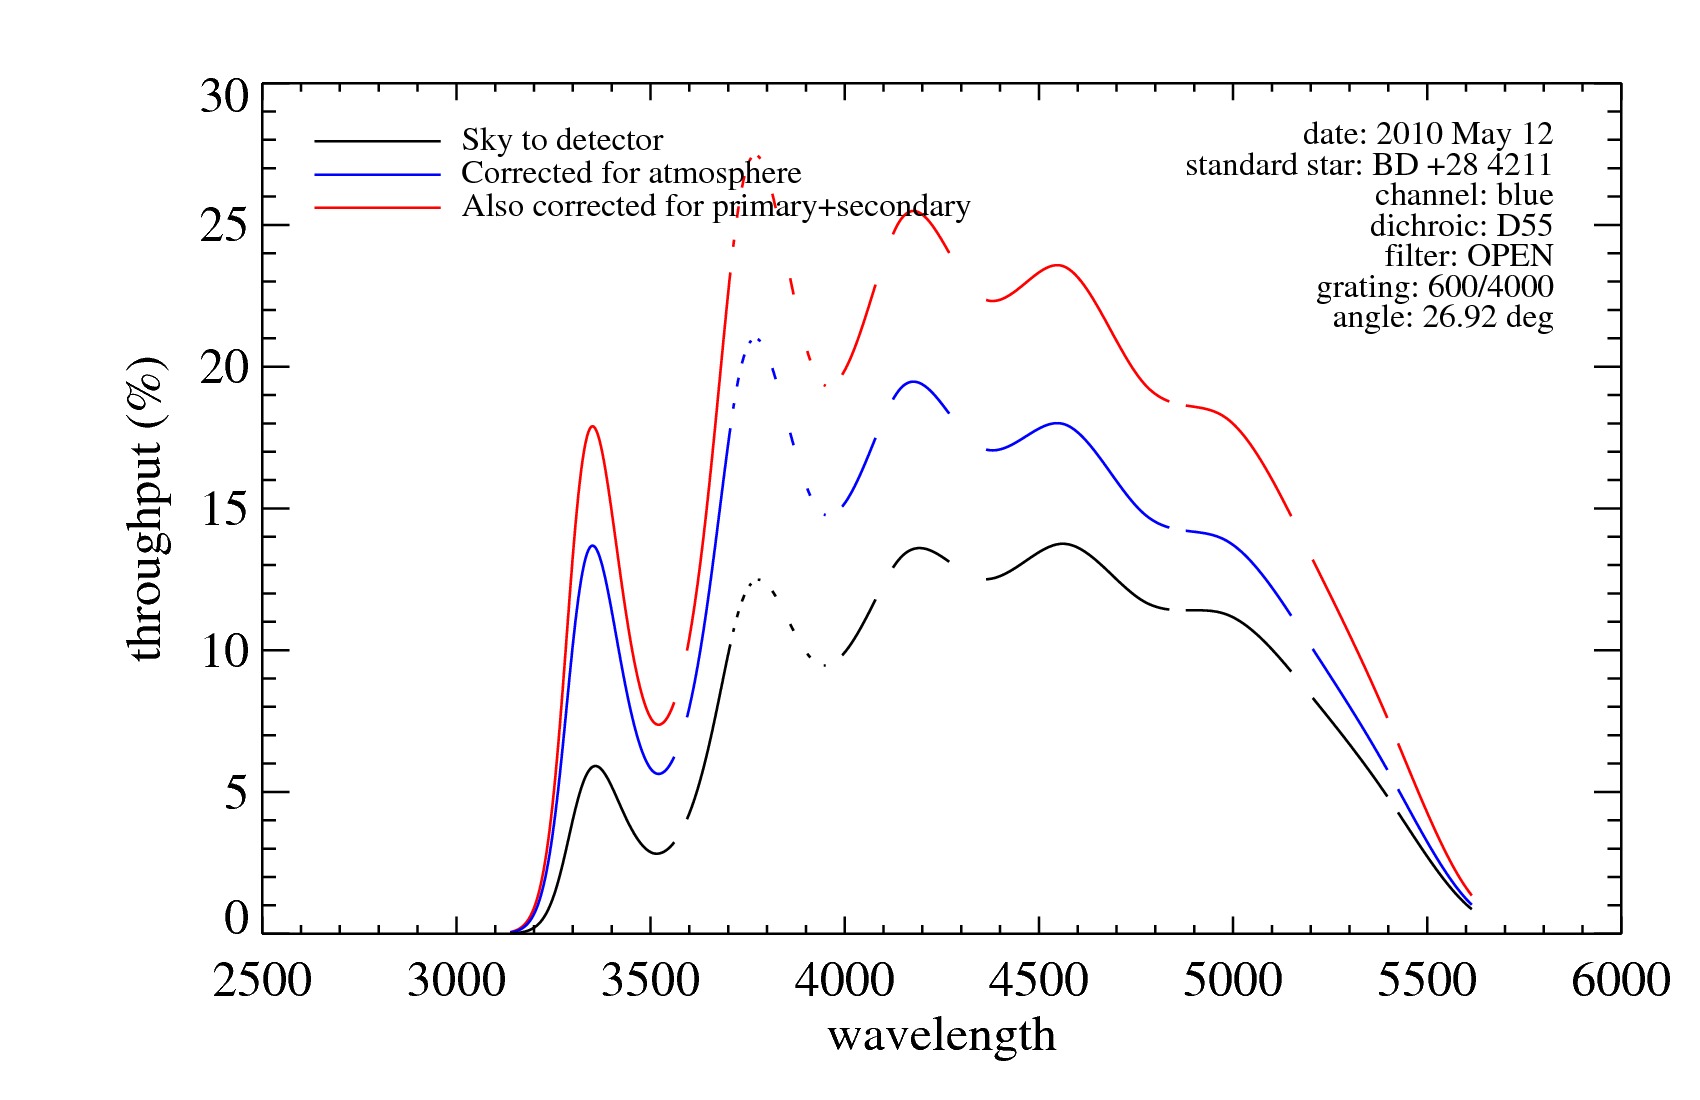
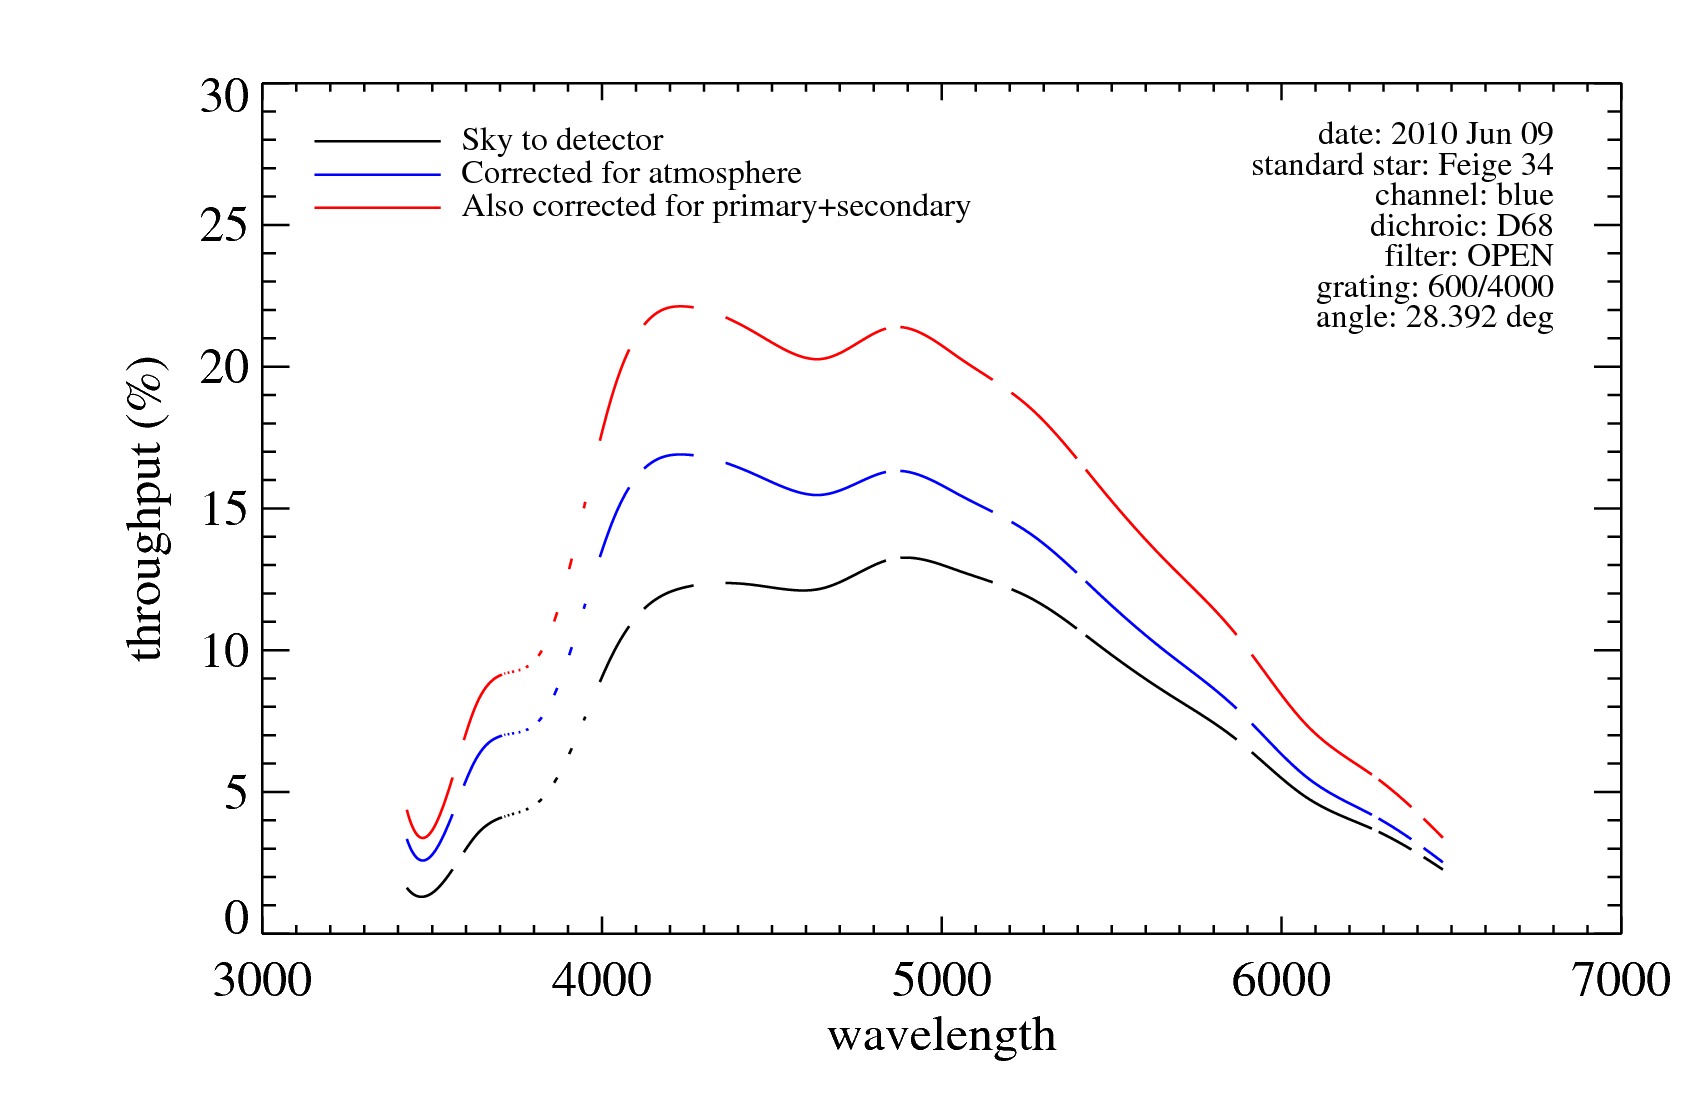
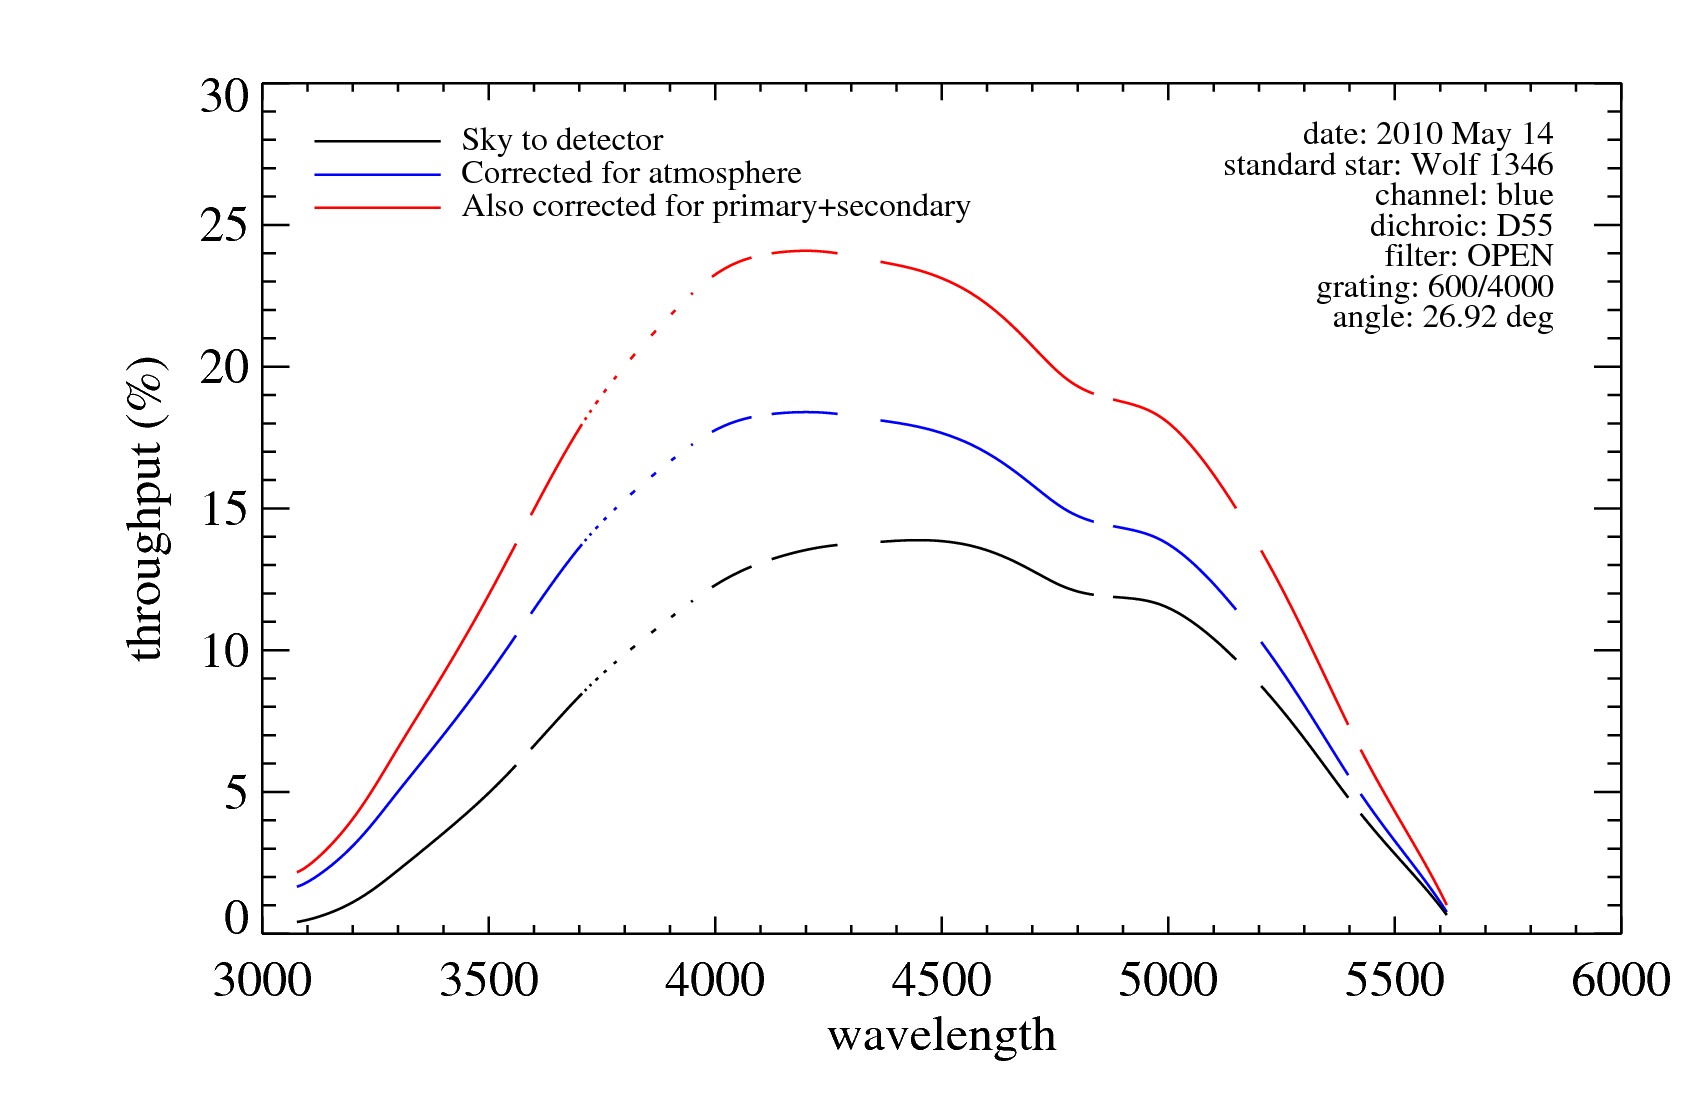
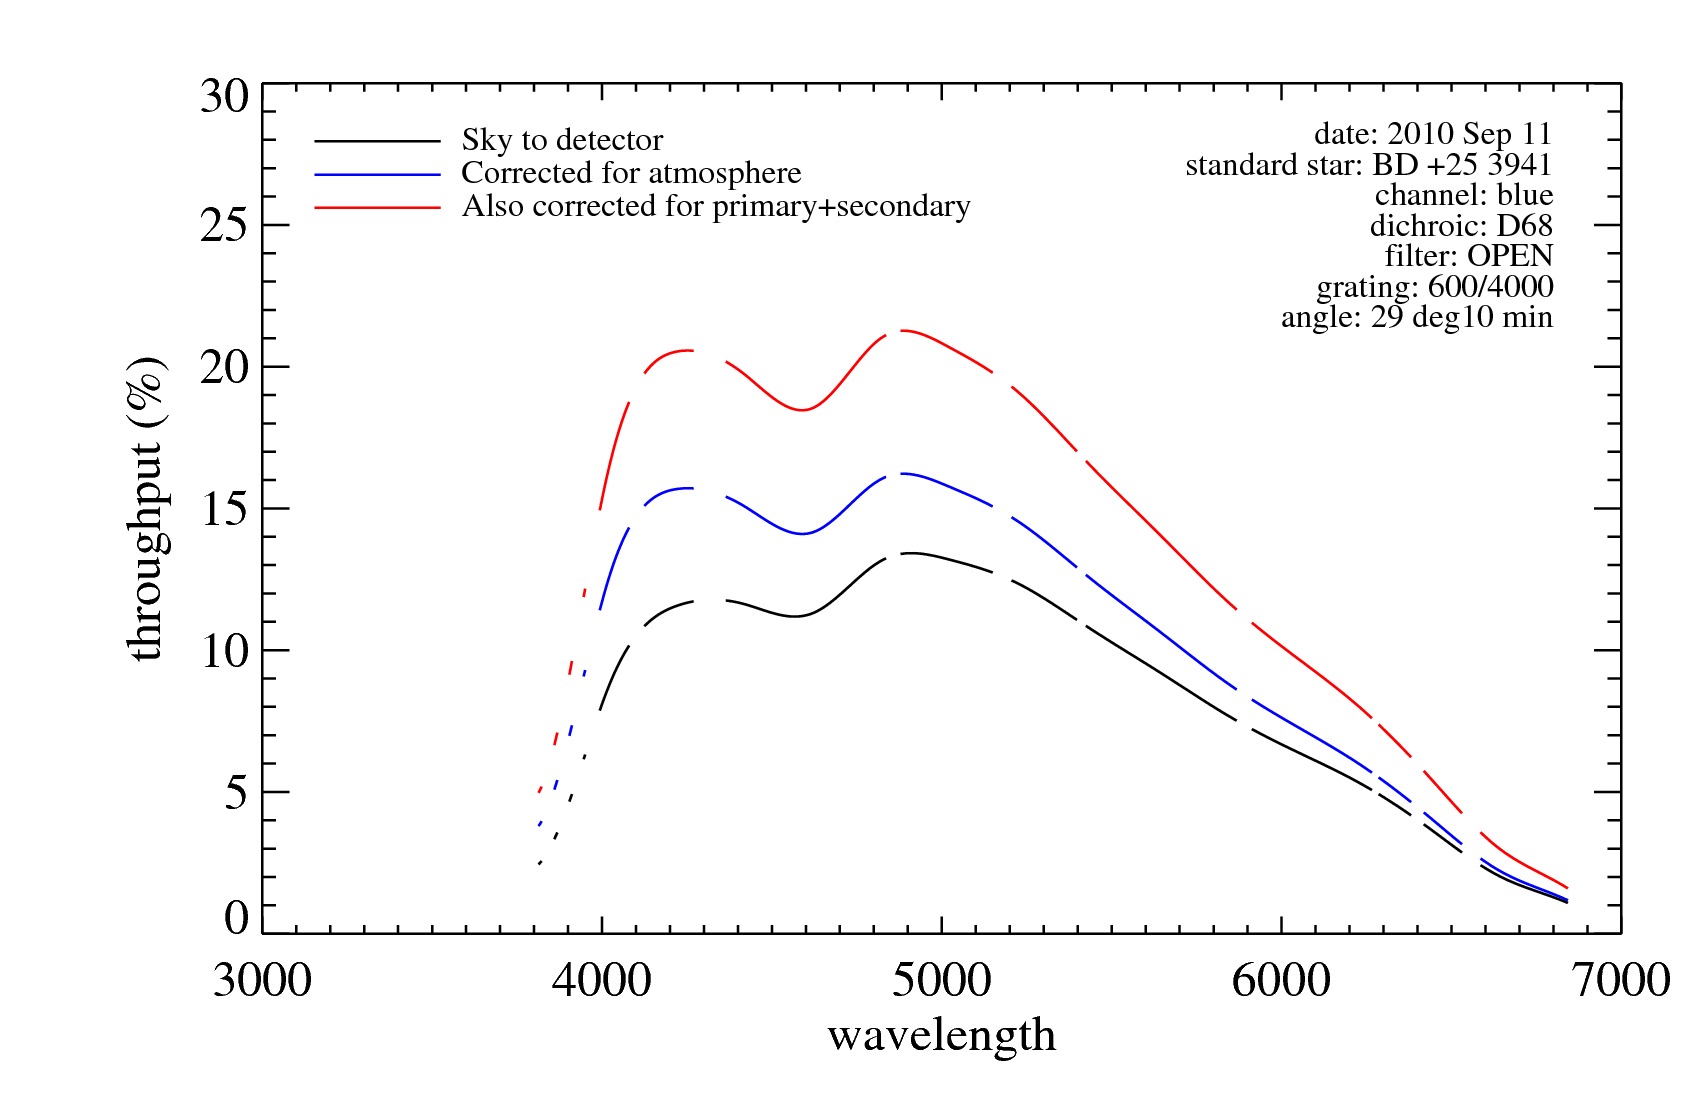
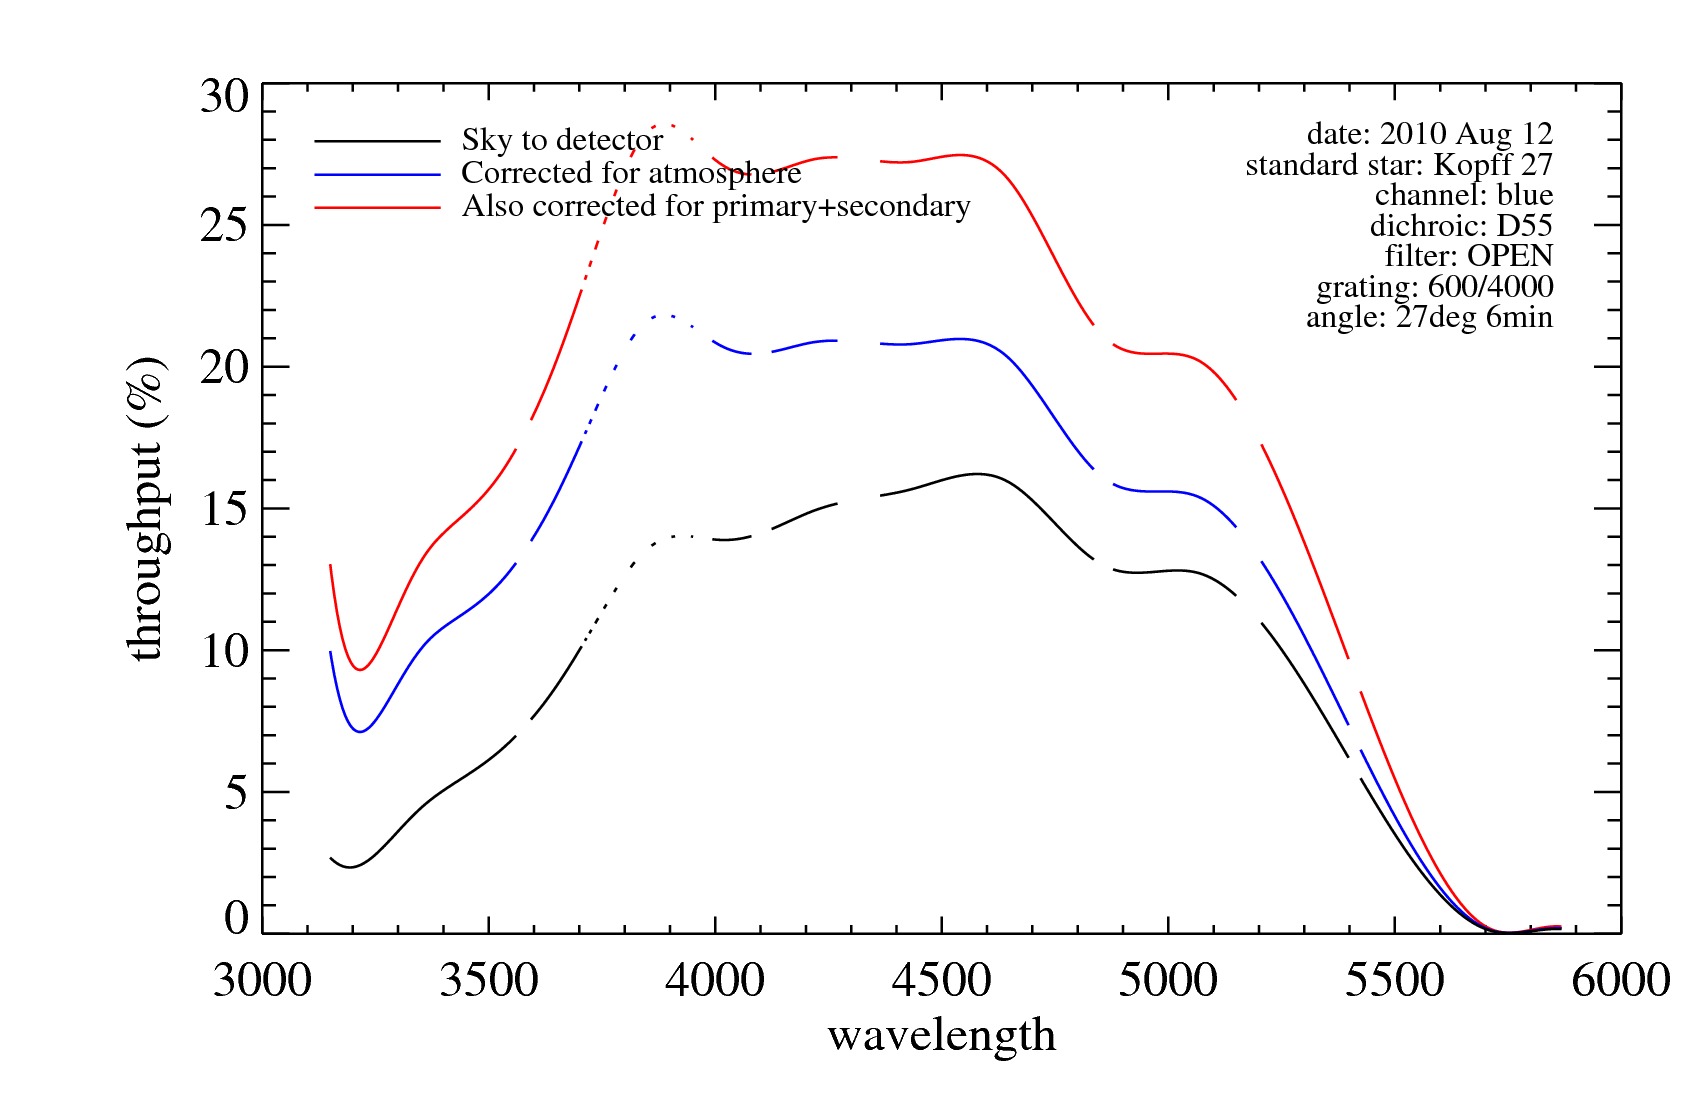
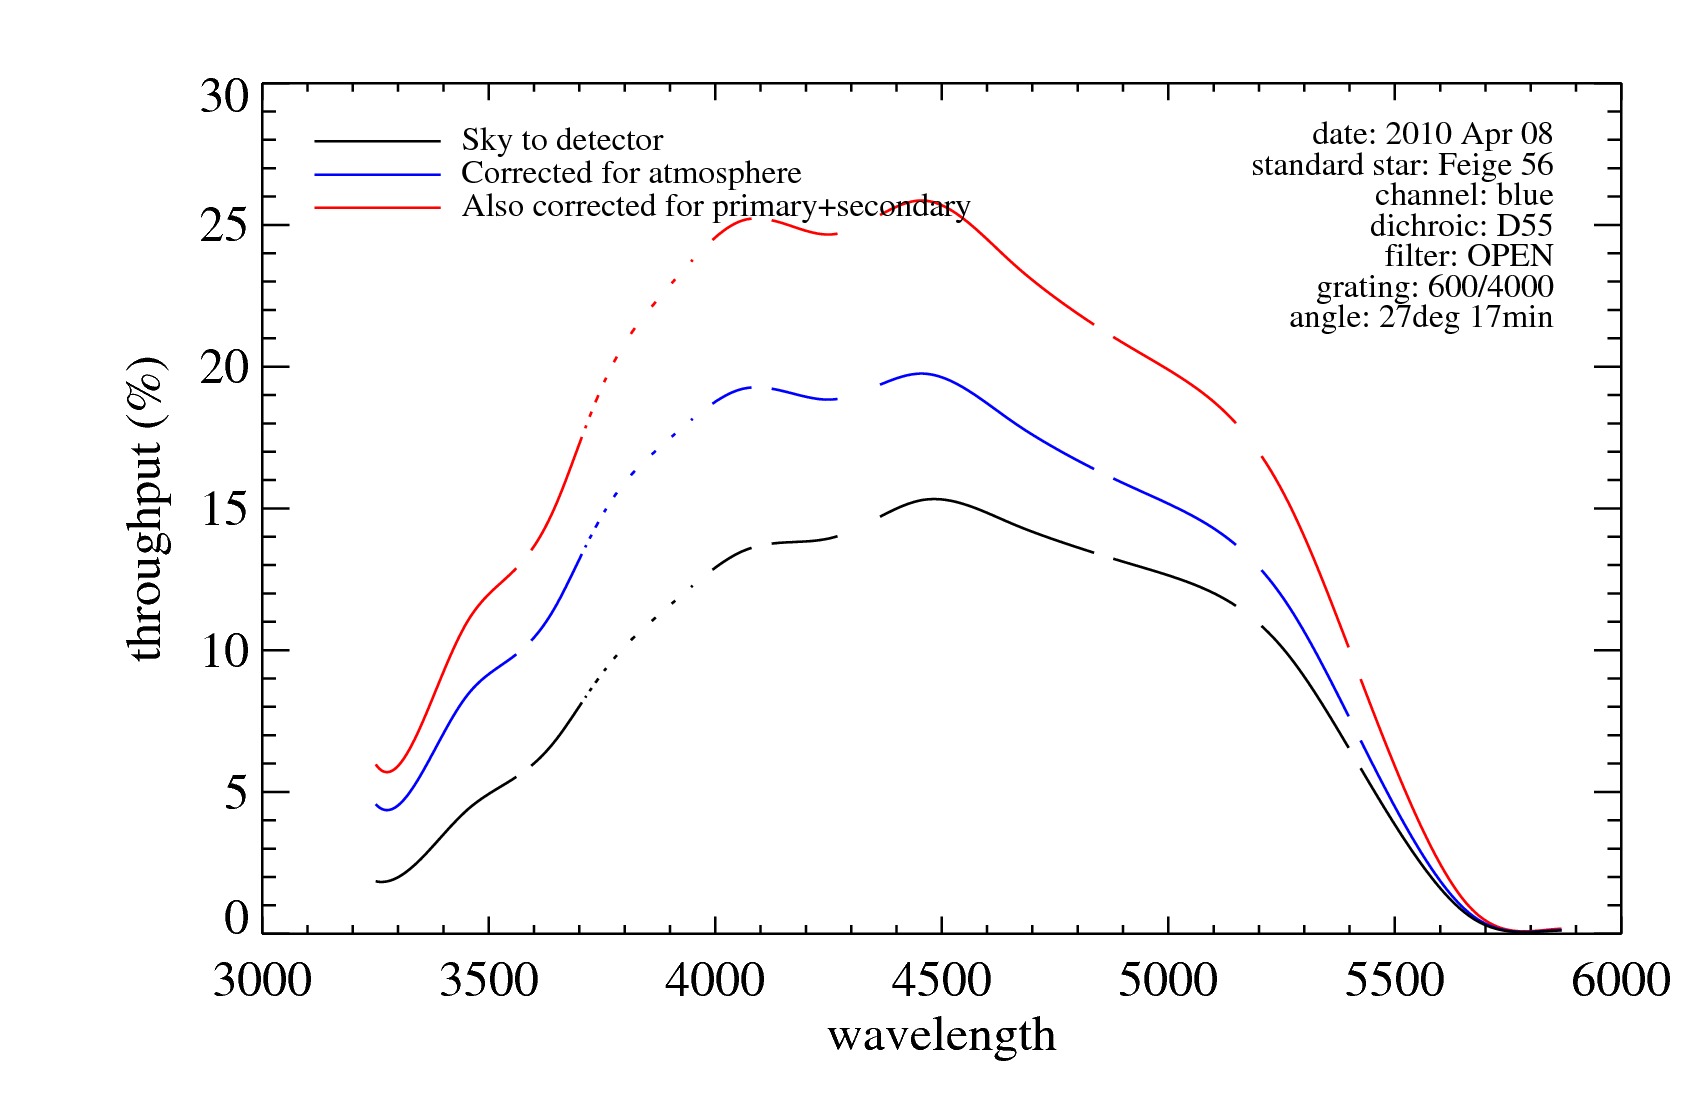
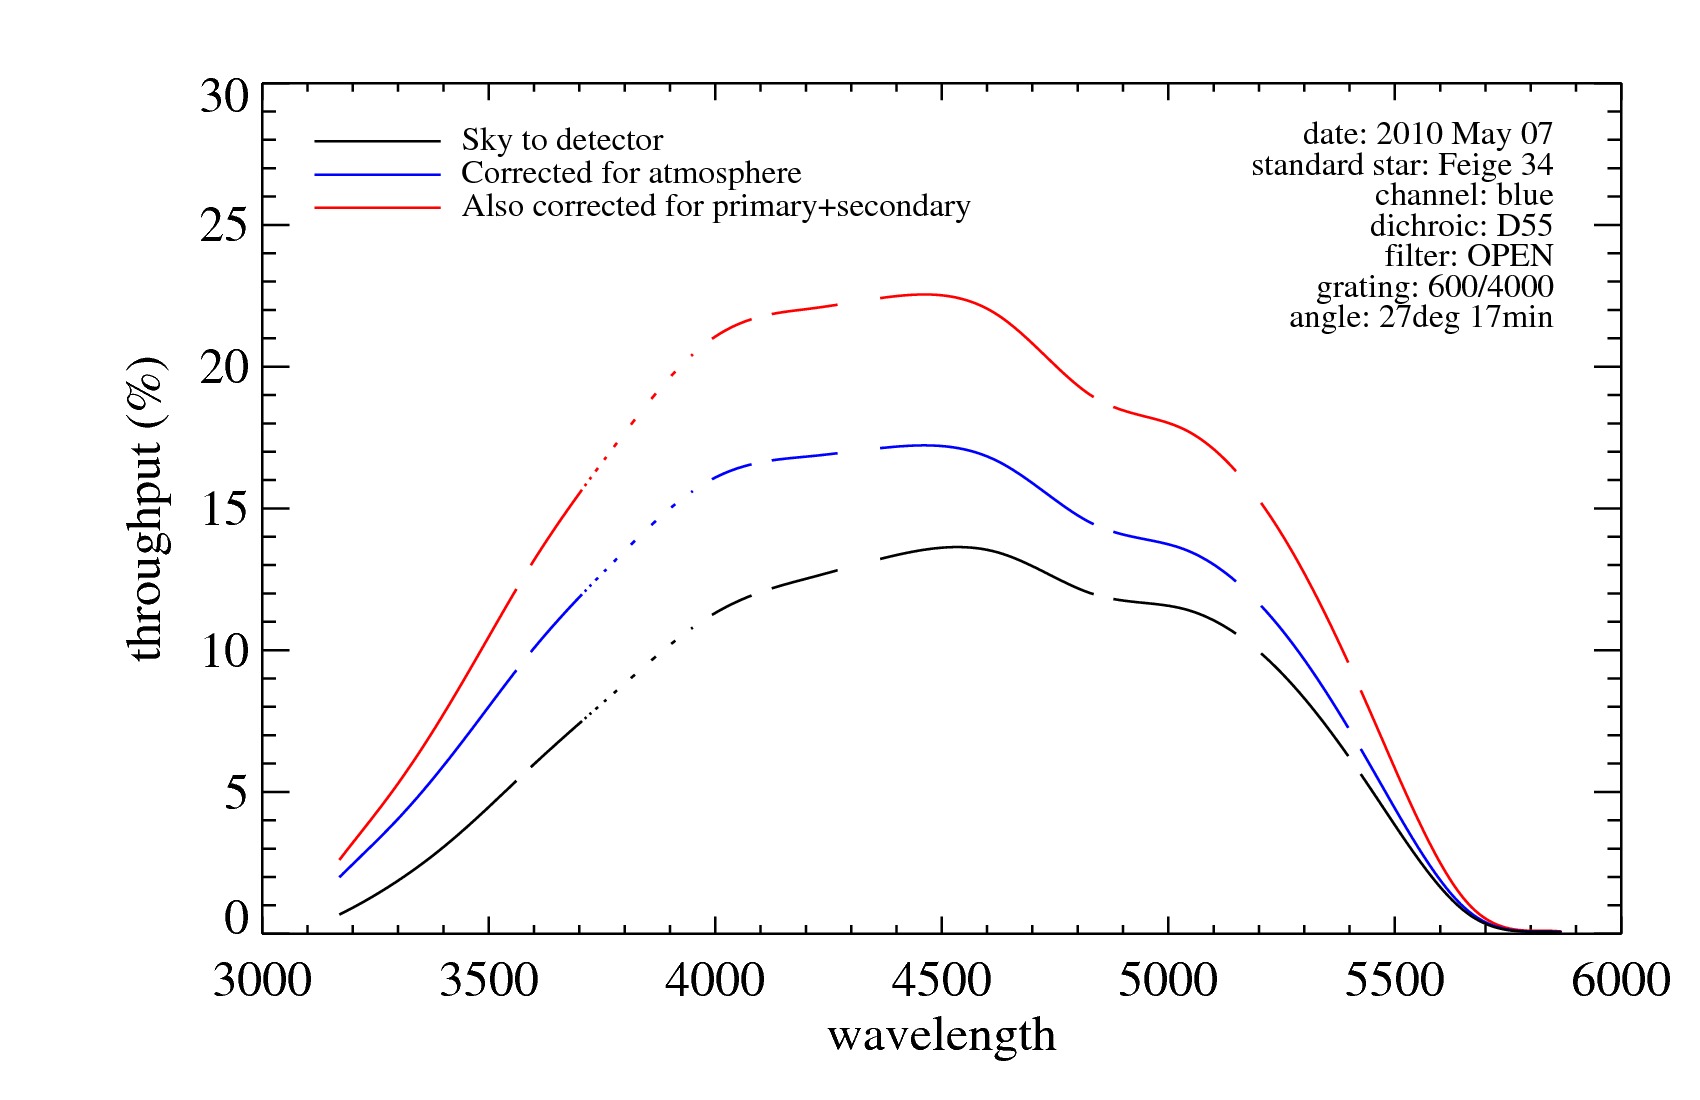
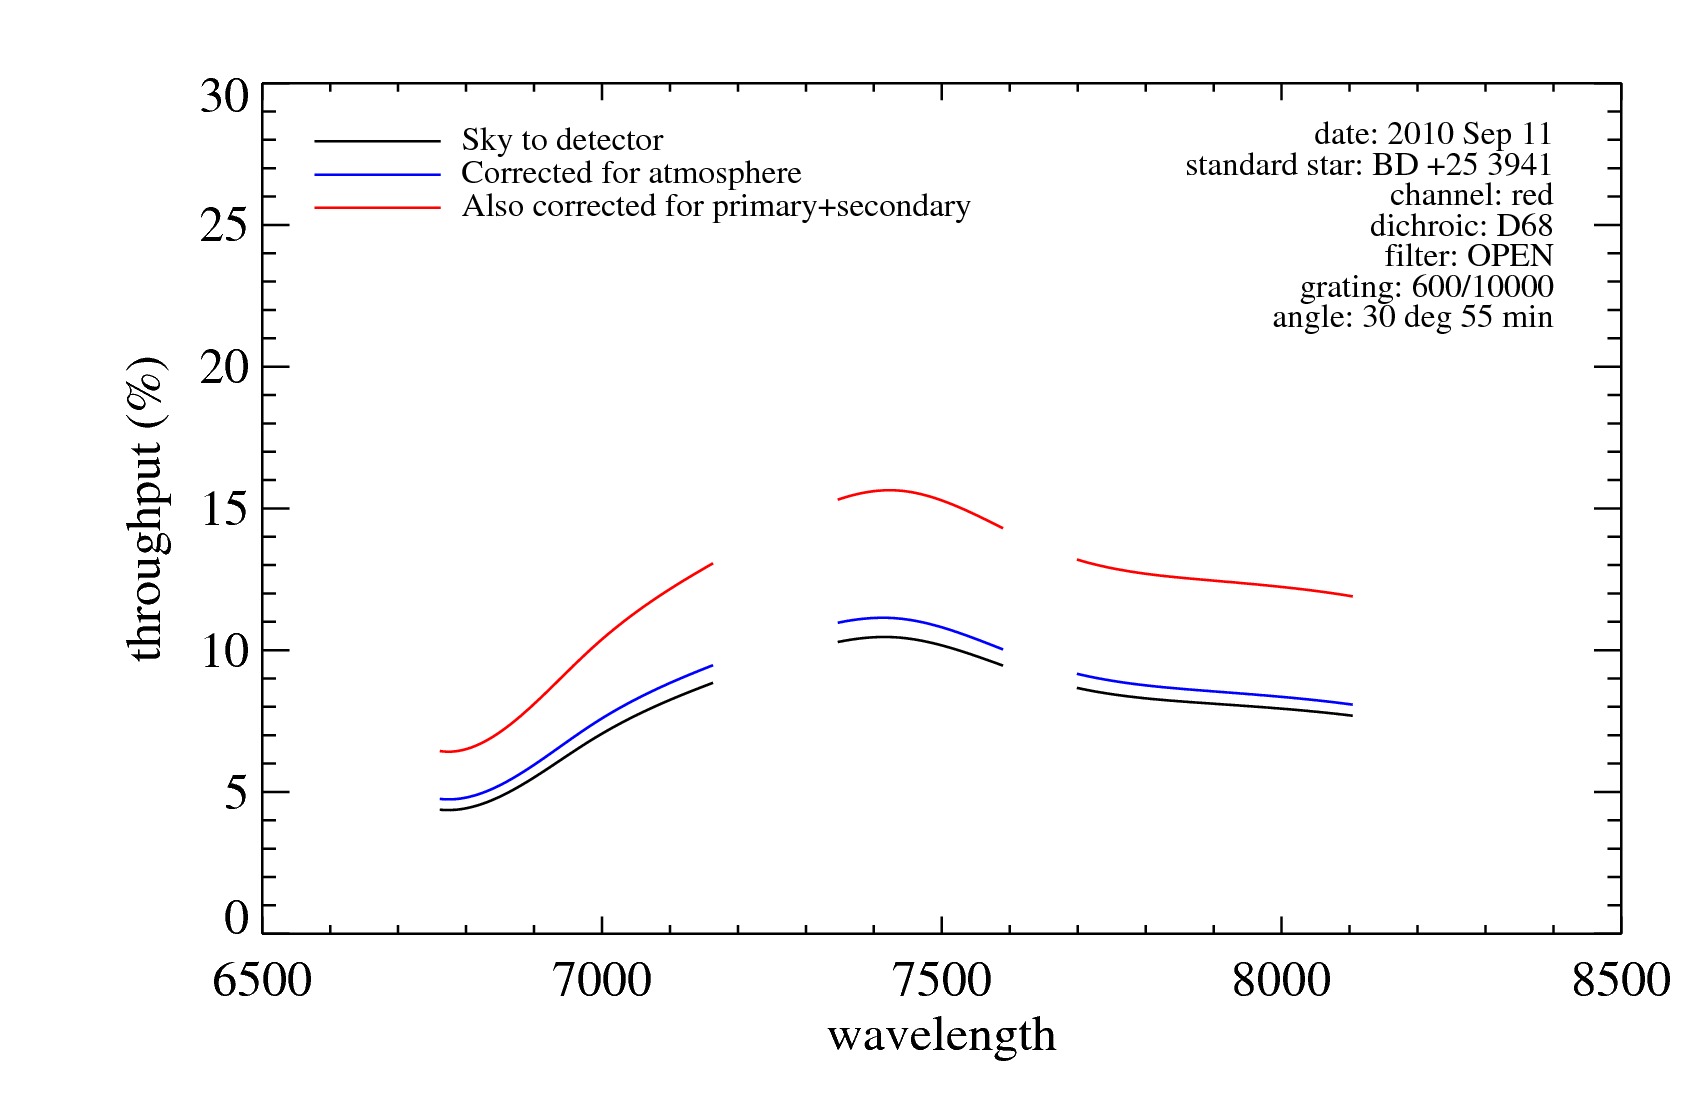
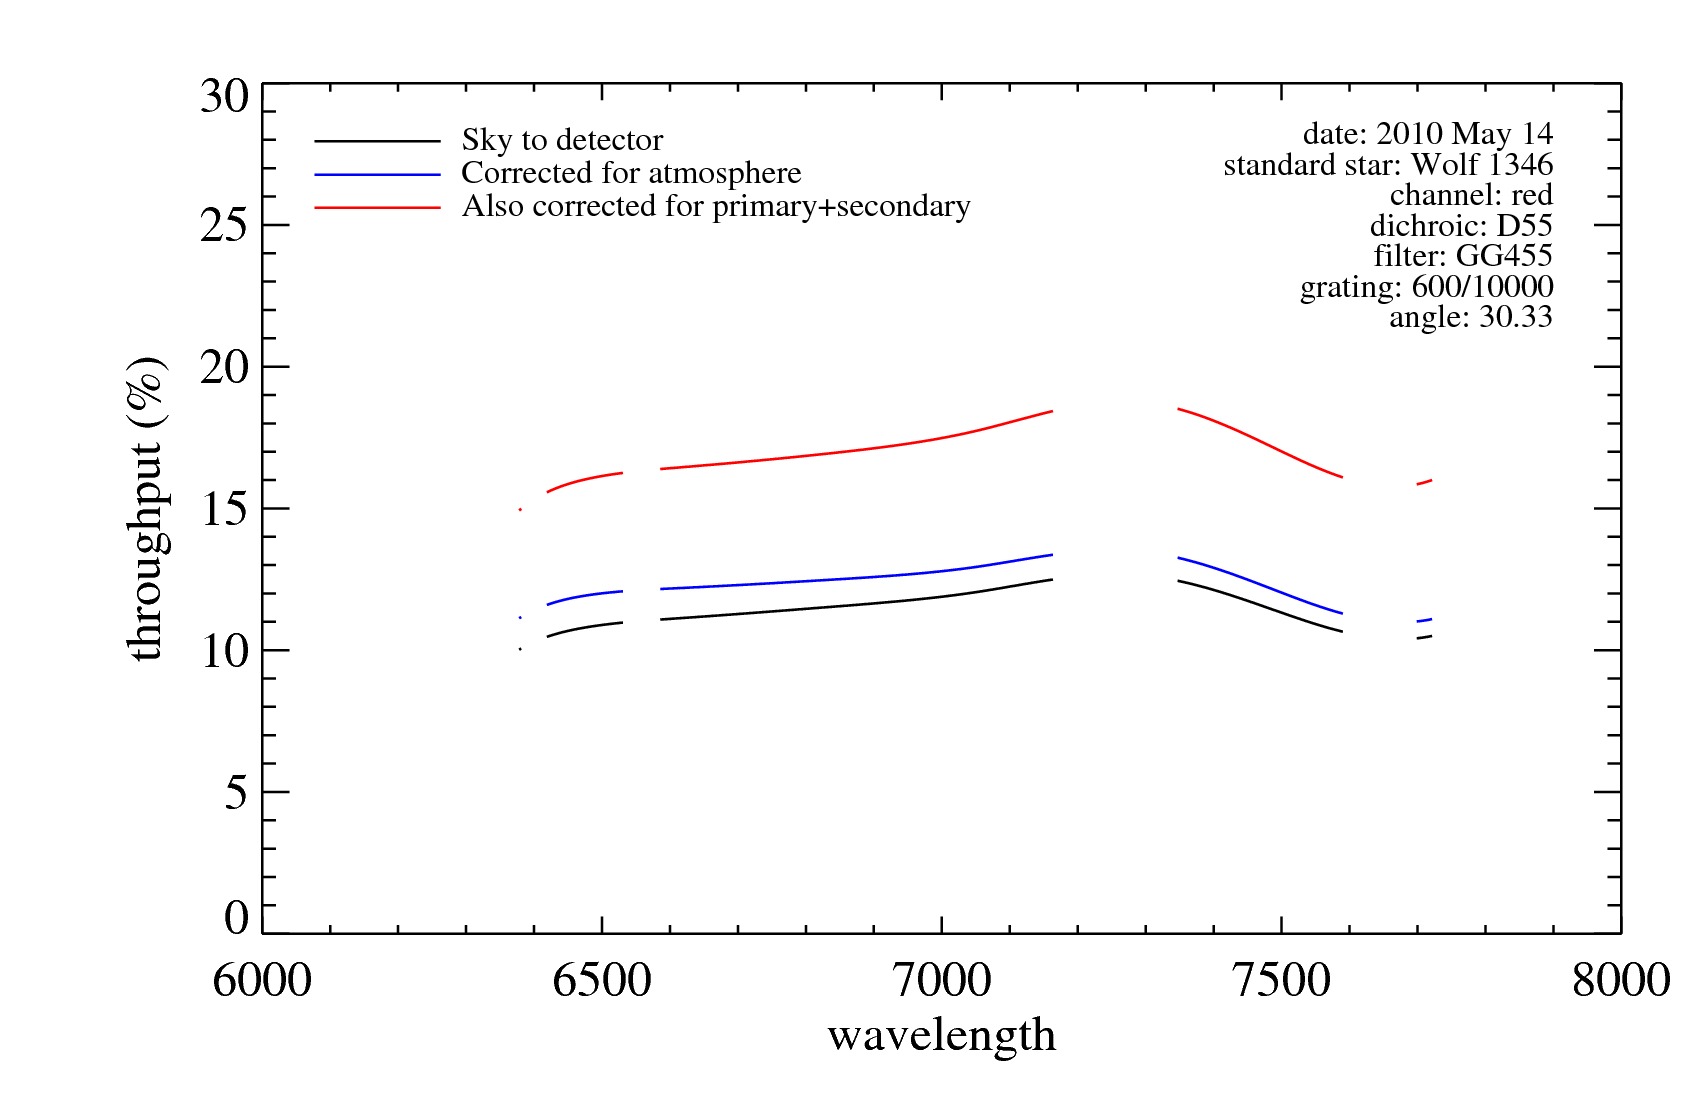
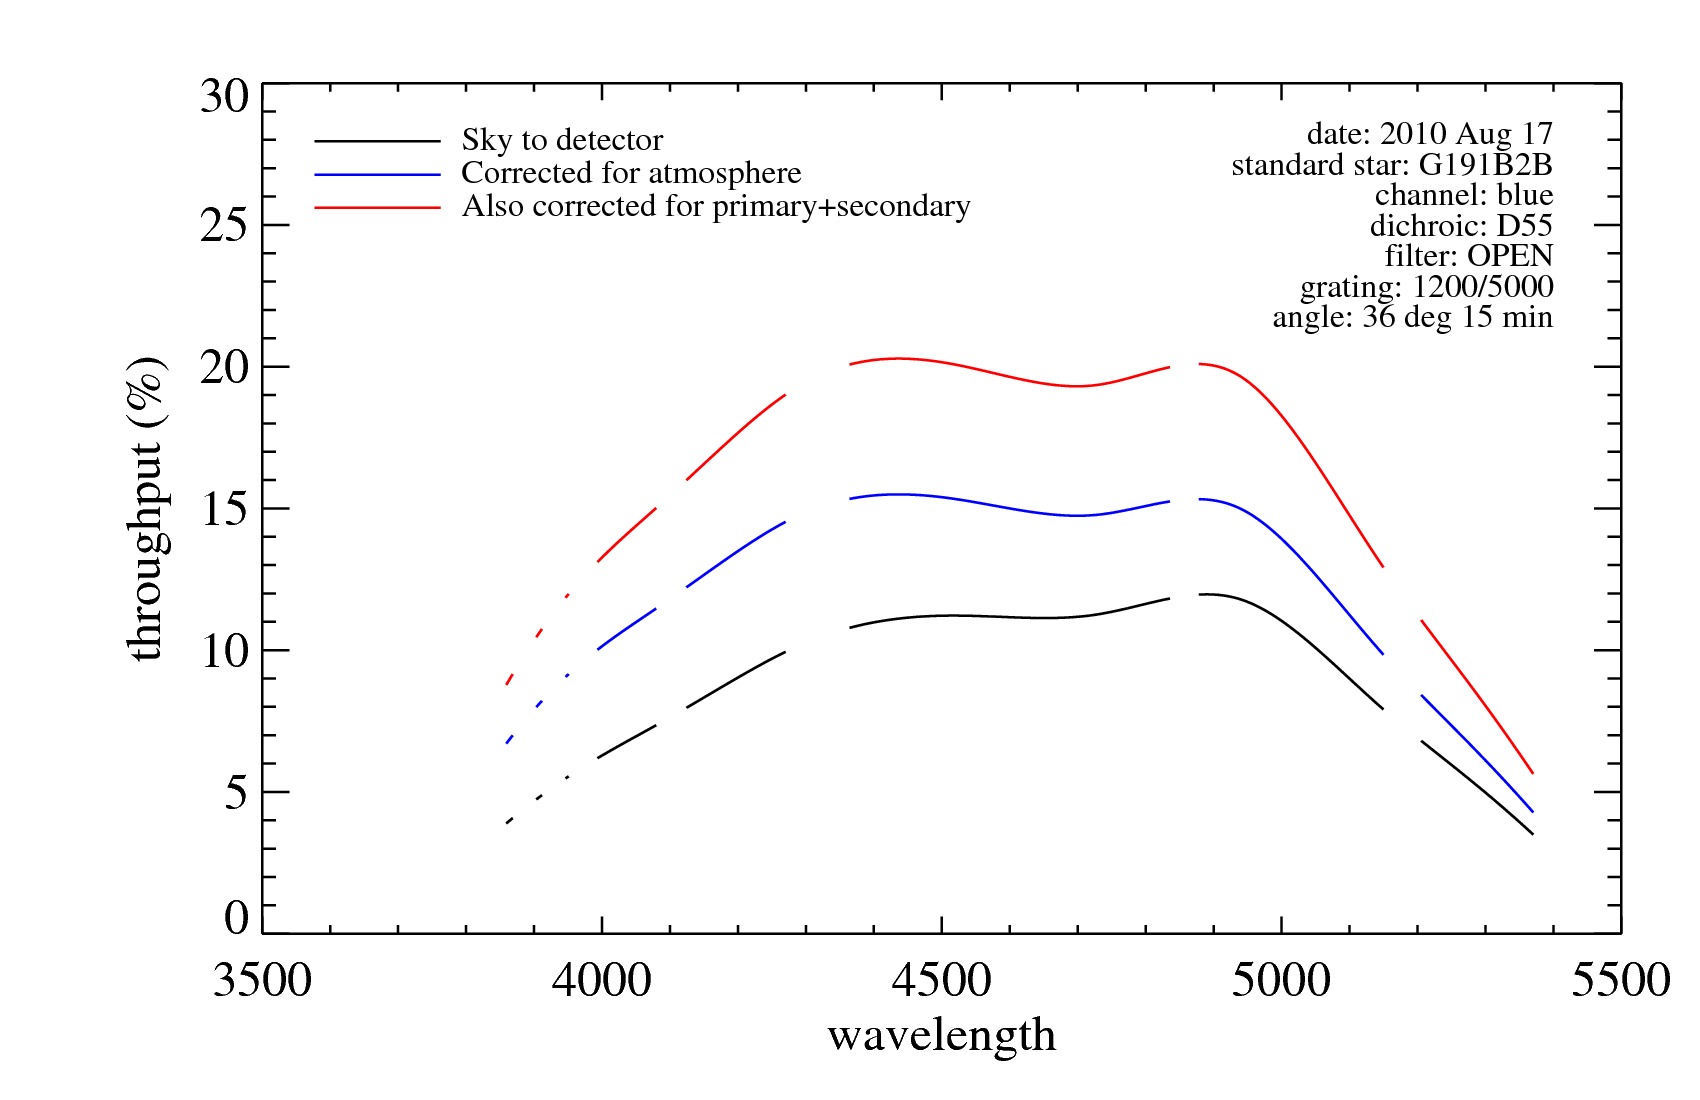
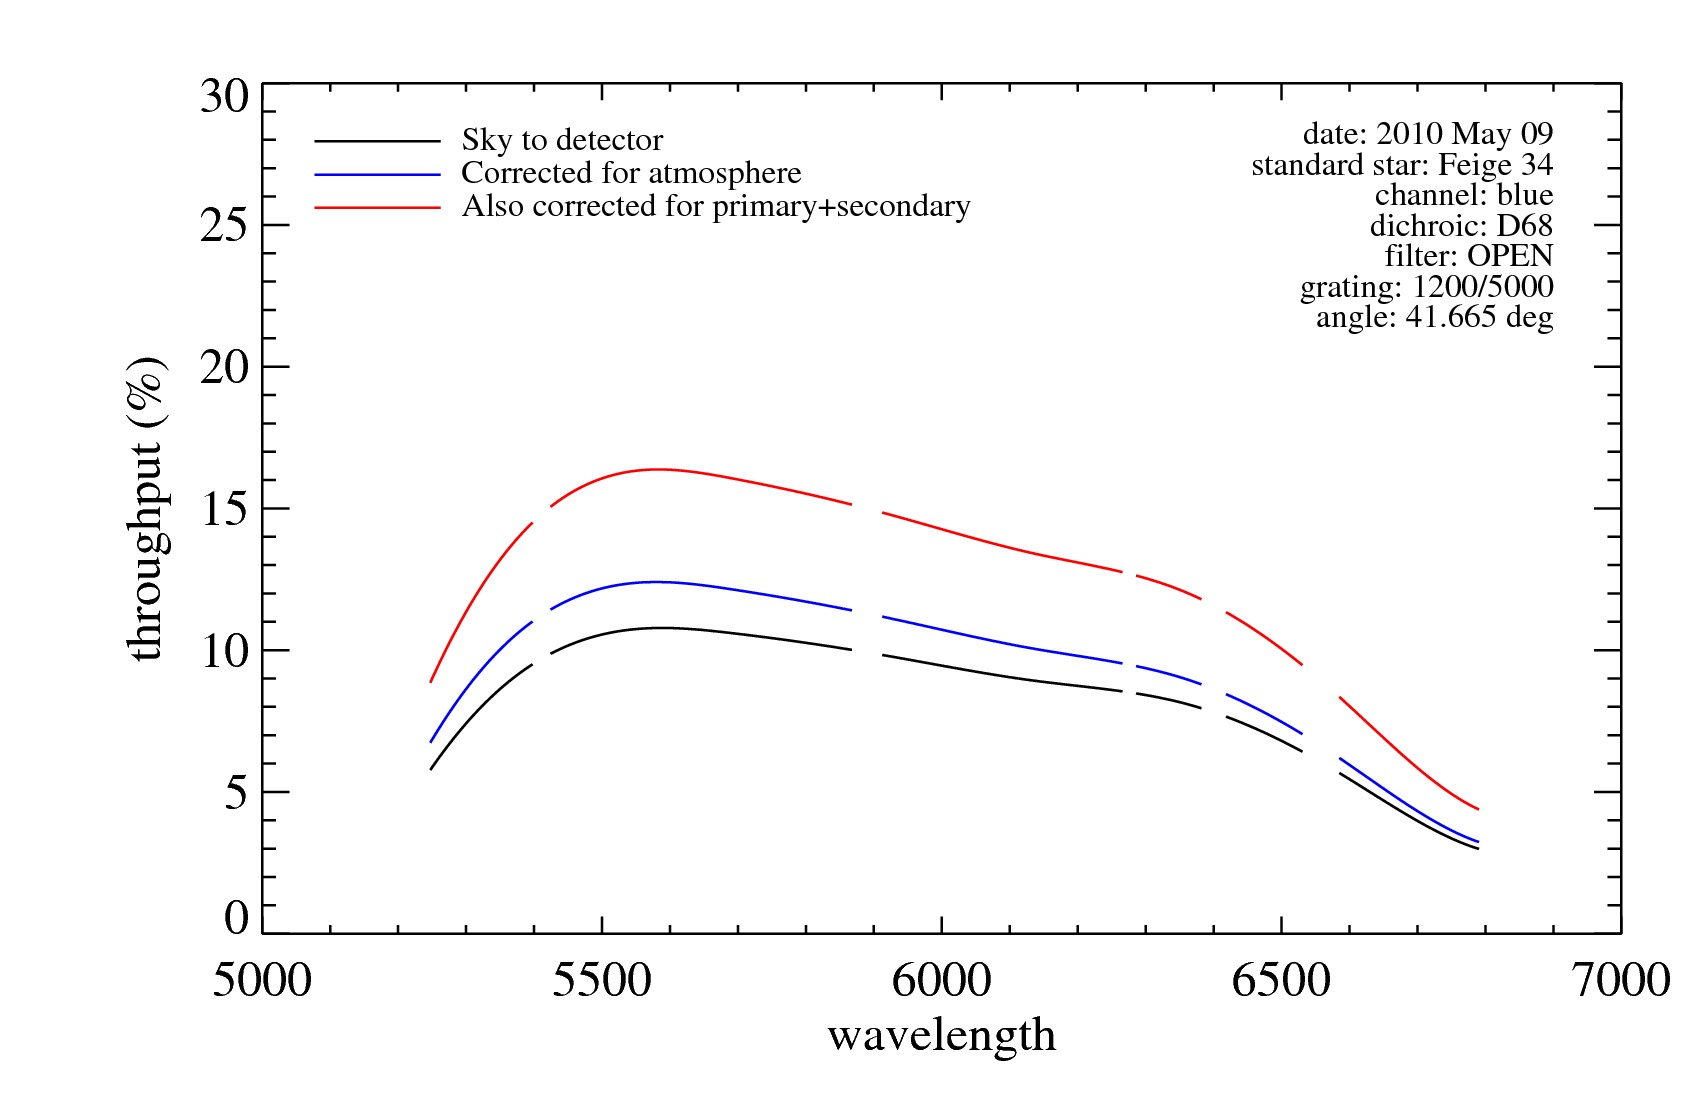
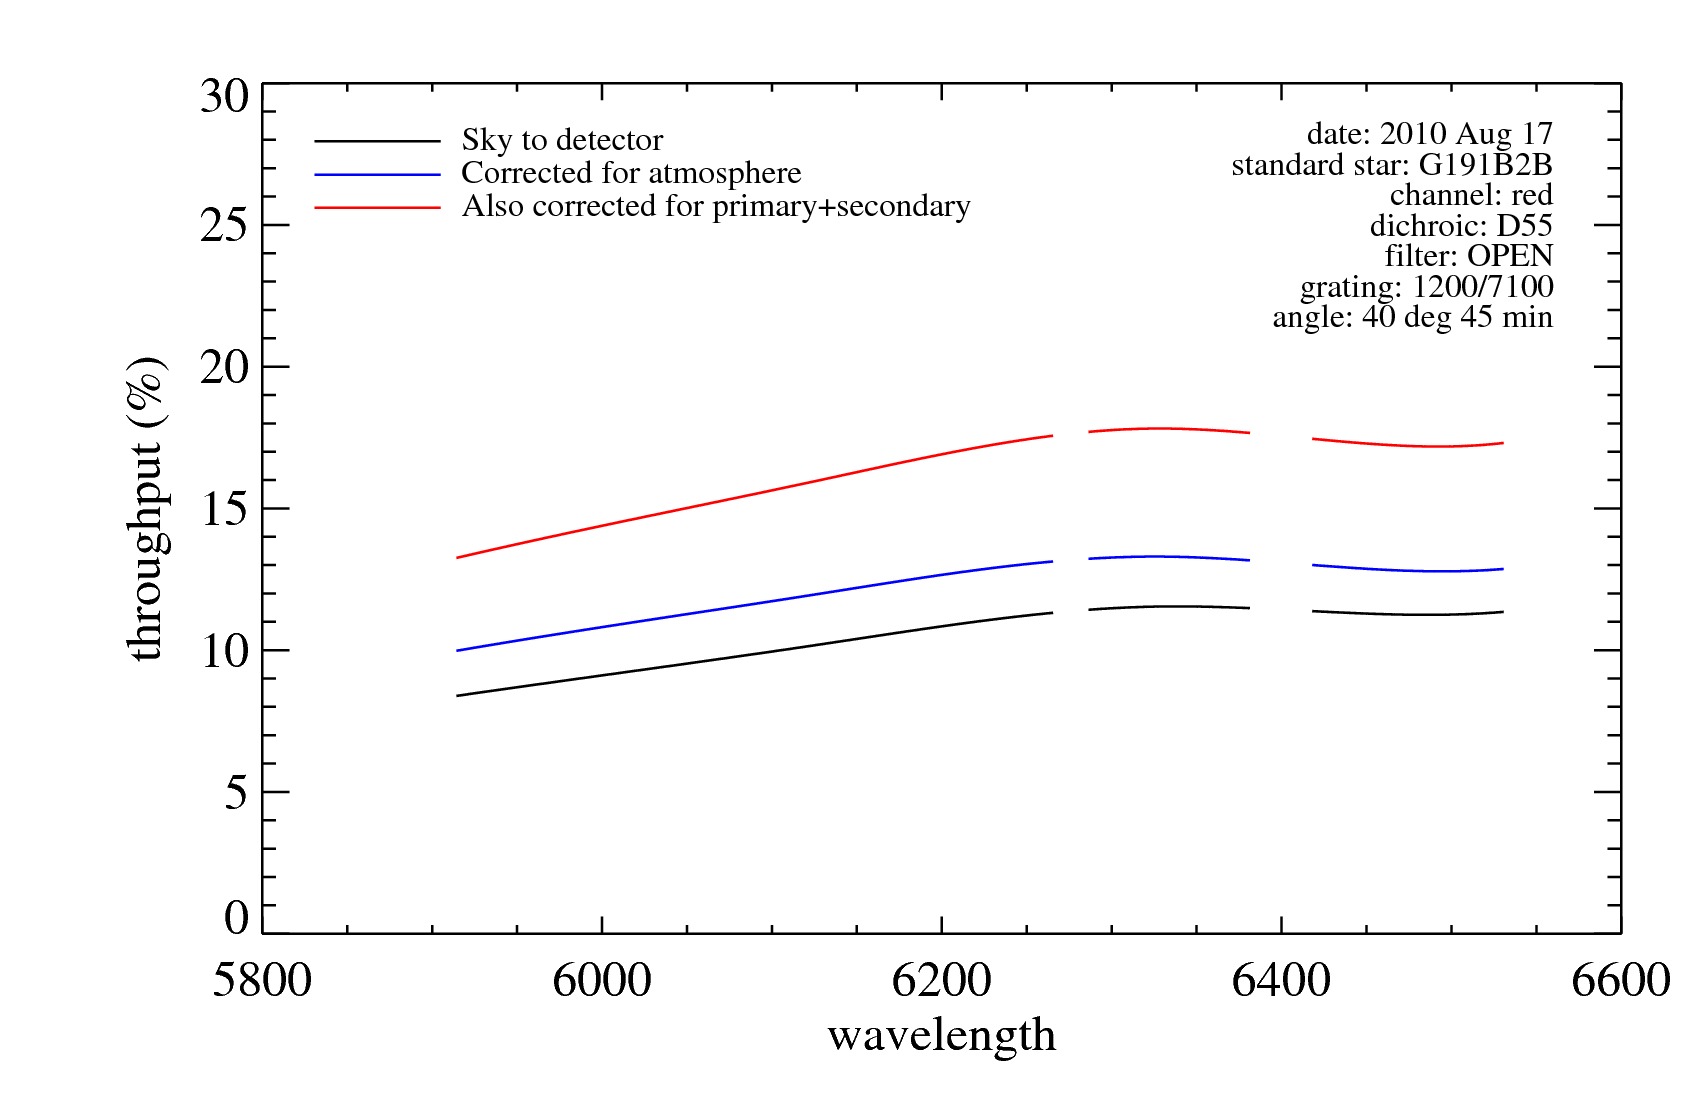
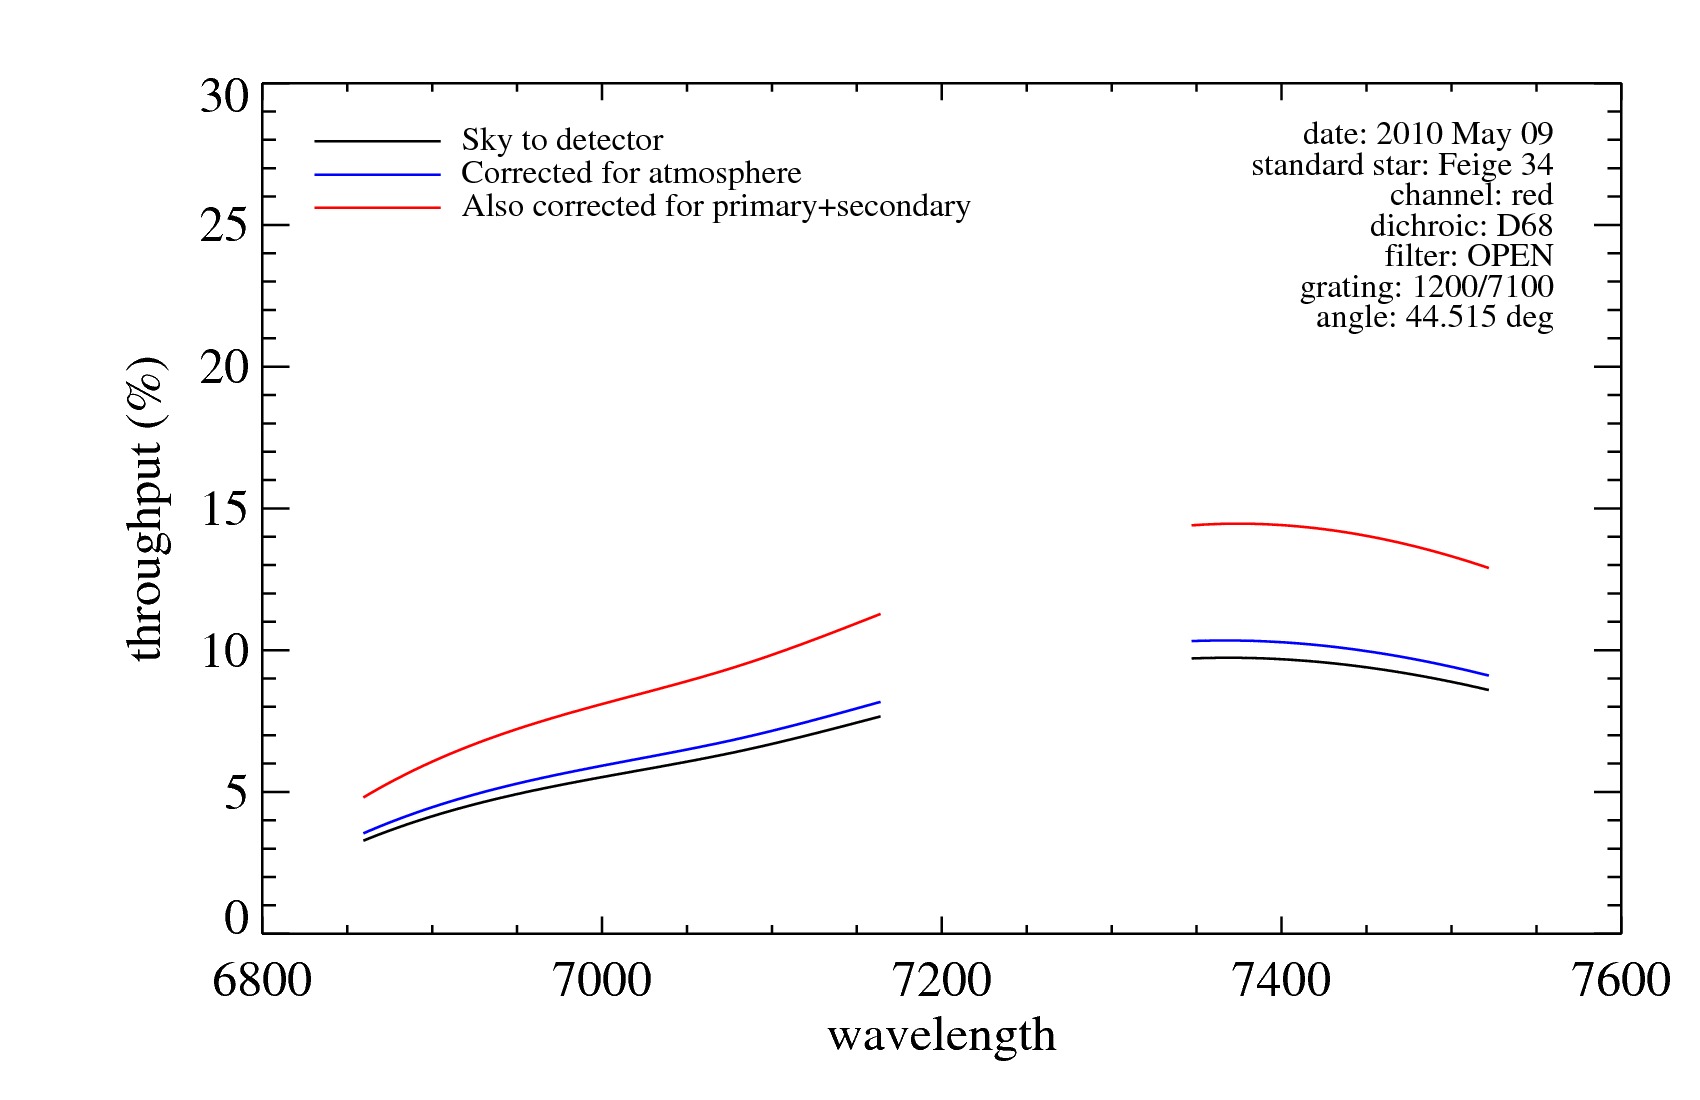
The following table gives throughput curves in graphical (plot) and tabular (data) form for different combinations of gratings and dichroic filters. In each table cell, the letter B or R indicates that the curve is valid for the blue or red channel. The following number is the grating tilt in degrees. Click on plot to see the graph of the throughput curve. Click on data to see the ASCII table with wavelength and precentage throughput. The curves show the sky-to-detector, telescope+spectrograph, and spectrograph-only throughput measurements (see steps 8-10 above). Finally, the date of the throughput measurement is given in parentheses. Some spectrograph configurations have more than one throughput measurement. Differences between them can give a rough idea of the uncertainty of the measurements.
Large fluctuations in throughput within a small spectral range are not real. These can be caused by incompletely excised telluric absorption bands or bad traces near the ends of the CCD.
| DBSP Throughput Curves | ||
|---|---|---|
| Grating / Dichroic | D55 | D68 |
| 158/7500 | R 21.0: plot data (2010-04-08) | |
| R 21.0: plot data (2010-05-07) | ||
| R 21.0: plot data (2010-06-08) | ||
| R 21.2: plot data (2010-05-21) | ||
| 316/7500 | R 24.8: plot data (2010-08-12) anomalously high throughput |
R 24.6: plot data (2010-06-09) |
| 300/3990 | B 22.9: plot data (2010-06-08) | |
| 600/4000 | B 26.9: plot data (2010-05-12) spurious fluctuations |
B 28.4: plot data (2010-06-09) |
| B 26.9: plot data (2010-05-14) | B 29.2: plot data (2010-09-11) | |
| B 27.1: plot data (2010-08-12) | ||
| B 27.3: plot data (2010-04-08) | ||
| B 27.3: plot data (2010-05-07) | ||
| B 27.4: plot data (2010-05-21) | ||
| 600/10000 | R 29.5: plot data (2010-05-12) | R 30.9: plot data (2010-09-11) |
| R 30.3: plot data (2010-05-14) | ||
| 1200/5000 | B 36.8: plot data (2010-08-17) | B 41.7: plot data (2010-05-09) |
| 1200/7100 | R 40.8: plot data (2010-08-17) | R 44.5: plot data (2010-05-09) |
Questions? We've answered many common observing and operations questions in our observer FAQ page.
Please share your feedback on this page or any other Palomar topic at the
COO Feedback portal.
DBSP Throughput / v 1.0.0
Last updated: 4 May 2022 ACM
|
|
|